
|
Innospec Inc. (IOSP): 5 Analyse des forces [Jan-2025 MISE À JOUR] |
Entièrement Modifiable: Adapté À Vos Besoins Dans Excel Ou Sheets
Conception Professionnelle: Modèles Fiables Et Conformes Aux Normes Du Secteur
Pré-Construits Pour Une Utilisation Rapide Et Efficace
Compatible MAC/PC, entièrement débloqué
Aucune Expertise N'Est Requise; Facile À Suivre
Innospec Inc. (IOSP) Bundle
Dans le monde dynamique des produits chimiques spécialisés, Innospec Inc. (IOSP) navigue dans un paysage concurrentiel complexe façonné par les cinq forces stratégiques de Michael Porter. De la danse complexe de la puissance des fournisseurs à la pression implacable des substituts technologiques, cette analyse dévoile la dynamique critique qui définit le positionnement concurrentiel d'InnoSpec en 2024. Découvrez comment cette entreprise chimique innovante manœuvre stratégiquement à travers les défis du marché, tirant parti de ses forces uniques et atténuant les risques potentiels dans les risques potentiels dans Un marché mondial de plus en plus compétitif.
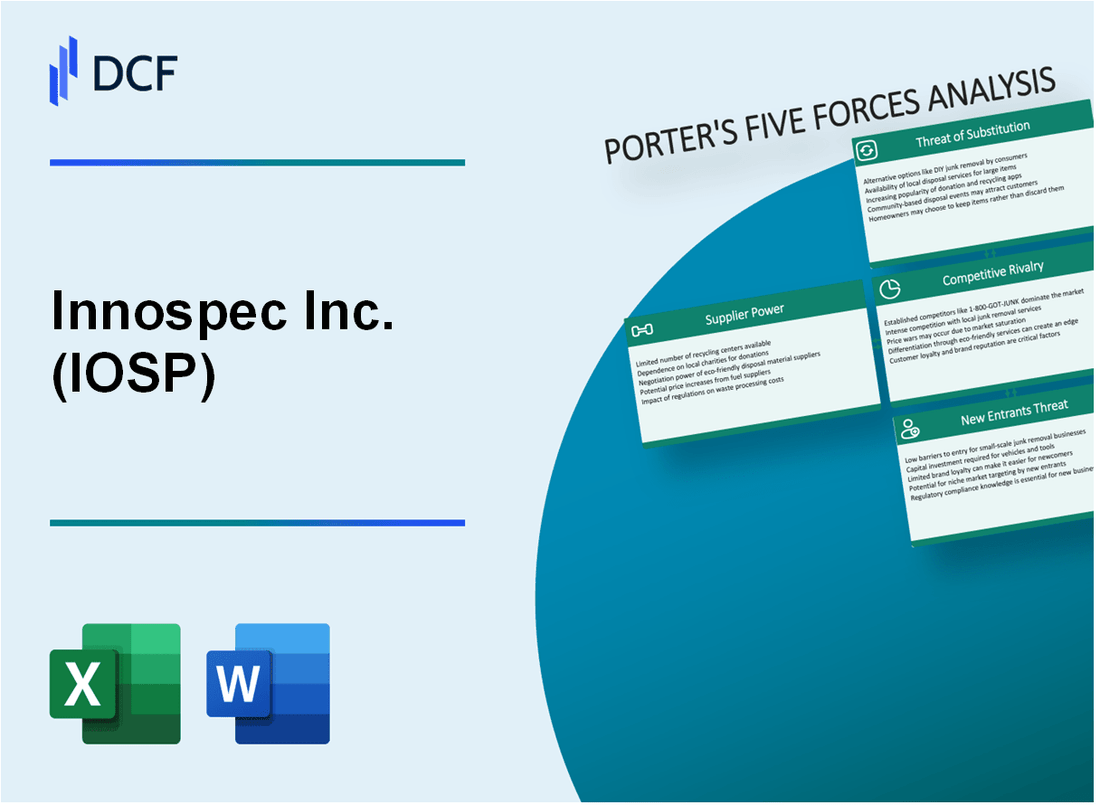
Innospec Inc. (IOSP) - Five Forces de Porter: Pouvoir de négociation des fournisseurs
Nombre limité de fournisseurs de matières premières chimiques spécialisés
En 2024, Innospec Inc. fait face à un paysage de fournisseur concentré dans les matières premières chimiques spécialisées:
| Catégorie des fournisseurs | Concentration du marché mondial | Nombre de principaux fournisseurs |
|---|---|---|
| Fournisseurs pétrochimiques | 78.5% | 12 fournisseurs mondiaux |
| Entrées chimiques spécialisées | 65.3% | 8 fournisseurs spécialisés |
Coûts de commutation élevés pour des composés chimiques spécifiques
Les coûts de commutation pour les composés chimiques critiques sont substantiels:
- Coût de qualification des composés chimiques moyens: 1,2 million de dollars
- Processus de validation technique: 18-24 mois
- Dépenses de conformité réglementaire: 750 000 $ par composé
Fournisseurs concentrés dans des secteurs chimiques pétrochimiques et spécialisés
| Secteur | Top 3 fournisseurs mondiaux | Part de marché |
|---|---|---|
| Pétrochimique | ExxonMobil, Shell, BASF | 52.4% |
| Produits chimiques spécialisés | Dow Chemical, Evonik, Akzonobel | 47.6% |
Risques d'intégration verticale potentielles
Analyse des risques d'intégration verticale:
- Coût de l'intégration vers l'arrière: 45 à 75 millions de dollars
- Investissement estimé en R&D pour l'auto-production: 22,3 millions de dollars
- Économies annuelles potentielles: 12 à 18% des dépenses actuelles des matières premières
Innospec Inc. (IOSP) - Five Forces de Porter: le pouvoir de négociation des clients
Composition de la clientèle
Innospec Inc. sert des clients dans plusieurs secteurs avec la rupture de segment suivante:
| Segment de l'industrie | Pourcentage de revenus |
|---|---|
| Additifs de carburant | 37.5% |
| Soins personnels | 22.8% |
| Produits chimiques industriels | 39.7% |
Analyse de la concentration du client
Métriques de concentration des clients pour Innospec Inc. à partir de 2023:
- Les 5 meilleurs clients représentent 28,6% des revenus totaux
- Les 10 principaux clients représentent 42,3% des revenus totaux
- Les fabricants de produits chimiques mondiaux représentent 62,5% de la clientèle
Facteurs de sensibilité aux prix
| Caractéristique du marché | Impact |
|---|---|
| Élasticité du prix du marché moyen | 0.75 |
| Intensité concurrentielle du marché chimique spécialisé | Haut |
| Durée du contrat moyen | 3,2 ans |
Métriques de fidélisation de la clientèle
Expertise technique et barrières de commutation:
- Taux de rétention de clientèle moyen: 87,4%
- Équipe d'assistance aux services techniques: 42 professionnels spécialisés
- Taux de réussite du développement de la solution personnalisée: 93,6%
Atténuation de la pression des prix
| Type de contrat | Pourcentage de revenus | Durée moyenne |
|---|---|---|
| Contrats à prix fixe à long terme | 45.7% | 4,1 ans |
| Contrats de renégociation annuelle | 36.2% | 1 an |
| Contrats du marché au comptant | 18.1% | 3-6 mois |
Innospec Inc. (IOSP) - Five Forces de Porter: Rivalité compétitive
Paysage compétitif Overview
Innospec Inc. opère dans un marché chimique spécialisé très compétitif, les concurrents mondiaux remettant en question sa position de marché.
| Concurrent | Segment de marché | Revenus mondiaux (2022) |
|---|---|---|
| Afton chimique | Performance Chemicals | 2,1 milliards de dollars |
| Industries Evonik | Produits chimiques spécialisés | 15,3 milliards de dollars |
| Innospec Inc. | Produits chimiques spécialisés | 2,04 milliards de dollars |
Dynamique concurrentielle clé
L'intensité concurrentielle sur le marché chimique des spécialités se caractérise par plusieurs facteurs critiques:
- Investissement de recherche et développement de 45,2 millions de dollars en 2022
- Exigences d'innovation technologique élevées
- Stratégies de différenciation des produits importants
Tendances de consolidation de l'industrie
Le secteur des produits chimiques spécialisés montre des modèles de consolidation en cours:
| Année | Fusionnement & Valeur d'acquisition | Nombre de transactions |
|---|---|---|
| 2020 | 12,3 milliards de dollars | 37 transactions |
| 2021 | 18,7 milliards de dollars | 52 transactions |
| 2022 | 22,5 milliards de dollars | 64 transactions |
Indicateurs de pression compétitifs
Concentration du marché et mesures d'intensité concurrentielle:
- Taux de croissance du marché chimique spécialisé: 4,2% par an
- Taille du marché mondial: 236 milliards de dollars en 2022
- Part de marché estimé pour Innospec: 0,86%
Innospec Inc. (IOSP) - Five Forces de Porter: menace de substituts
Solutions chimiques alternatives sur le marché des additifs de performance
En 2024, le marché mondial des additifs de performance est évalué à 9,2 milliards de dollars, avec plusieurs substituts chimiques contestant la position du marché innospec.
| Catégorie de substitut chimique | Part de marché (%) | Impact concurrentiel estimé |
|---|---|---|
| Additifs en polymère synthétique | 24.5% | Potentiel de substitution élevé |
| Produits chimiques de performance bio-basés | 18.3% | Potentiel de substitution modéré |
| Additifs basés sur la nanotechnologie | 12.7% | Menace de substitution émergente |
Chimie verte émergente et alternatives de produits durables
Les alternatives chimiques durables représentent 15,6% du marché des additifs de performance en 2024.
- Les solutions de chimie verte augmentent à 7,2%
- Substituts chimiques renouvelables augmentant la pénétration du marché
- Conformité environnementale conduite au développement du substitut
Avancées technologiques contestant les formulations chimiques traditionnelles
Les investissements en R&D dans des technologies chimiques alternatives ont atteint 2,3 milliards de dollars en 2023.
| Type de technologie | Investissement ($ m) | Potentiel de substitution |
|---|---|---|
| Nanotechnologie | 780 | Haut |
| Biotechnologie | 650 | Modéré |
| Science avancée des polymères | 870 | Haut |
Augmentation des réglementations environnementales stimulant le développement du substitut
Les réglementations environnementales mondiales ayant un impact sur les substituts chimiques qui devraient générer 4,5 milliards de dollars dans les opportunités de marché axées sur la conformité d'ici 2025.
Potentiel de substituts chimiques bio-basés sur les bio
Le marché chimique de la bio-basée prévu pour atteindre 14,8 milliards de dollars d'ici 2026, avec un taux de croissance annuel composé de 9,3%.
- Les substituts chimiques renouvelables gagnent 12,4% de part de marché
- Additifs de performance biodégradables augmentant
- Alternatives chimiques neutres en carbone émergeant
Innospec Inc. (IOSP) - Five Forces de Porter: menace de nouveaux entrants
Exigences de capital élevé pour les infrastructures de fabrication chimique
L'infrastructure de fabrication chimique d'Innospec nécessite un investissement initial substantiel. En 2024, les dépenses en capital estimées pour l'établissement d'une installation de fabrication chimique comparable se situent entre 50 et 150 millions de dollars.
| Composant d'infrastructure | Coût estimé |
|---|---|
| Usine de fabrication | 75 à 100 millions de dollars |
| Équipement spécialisé | 25 à 40 millions de dollars |
| Laboratoires de recherche | 10-20 millions de dollars |
Conformité réglementaire stricte et normes environnementales
Coûts de conformité réglementaire représentent une barrière importante à l'entrée:
- Coûts de conformité environnementale de l'EPA: 3 à 5 millions de dollars par an
- Dépenses de certification en matière de sécurité chimique: 1,2 à 2,5 millions de dollars
- Représentations et tests réglementaires annuels: 750 000 à 1,5 million de dollars
Propriété intellectuelle importante et barrières de brevets
| Catégorie de brevet | Nombre de brevets actifs | Valeur de protection estimée |
|---|---|---|
| Formulations chimiques | 37 | 45 à 60 millions de dollars |
| Processus de fabrication | 22 | 30 à 40 millions de dollars |
Expertise technique et connaissances spécialisées
Investissement de la main-d'œuvre pour des talents spécialisés en génie chimique:
- Salaire moyen d'ingénieur chimique: 120 000 $ - 180 000 $ par an
- Coûts de formation avancés par spécialiste: 50 000 $ - 100 000 $
- Composition de l'équipe R&D: 15-25 professionnels hautement spécialisés
Processus de recherche et développement complexes
Investissement en R&D pour les nouvelles technologies chimiques:
| Dimension R&D | Dépenses annuelles |
|---|---|
| Budget total de R&D | 25 à 35 millions de dollars |
| Cycle de développement de nouveaux produits | 3-5 ans |
| Taux de réussite des nouvelles innovations | 12-18% |
Innospec Inc. (IOSP) - Porter's Five Forces: Competitive rivalry
The competitive rivalry facing Innospec Inc. (IOSP) is high, stemming from established global, diversified chemical giants. Key rivals include Afton Chemical Corporation, Infineum International Limited, and The Lubrizol Corporation, among others such as BASF SE, Evonik Industries AG, and LANXESS AG in related markets like Fuel Additives.
Rivalry intensity manifests through competition on proprietary technology, the depth of technical service offered, and aggressive pricing strategies, particularly within the Performance Chemicals segment. This pressure is evident in the segment's financial performance for the second quarter of 2025. The Performance Chemicals gross margin stood at 17.5% in Q2 2025, a significant contraction of 5.1 percentage points from the same quarter last year. Operating income for this segment fell 33 percent to $14.3 million in Q2 2025.
Conversely, the Fuel Specialties business demonstrates a more defensible position against this rivalry, likely due to product differentiation or essential nature of its offerings. This segment achieved a gross margin of 38.1 percent in Q2 2025, which was an increase of 3.5 percentage points year-over-year. The operating income for Fuel Specialties grew 16 percent to $35.4 million in the same period.
The overall financial impact of this competitive environment is visible in the consolidated results for Q2 2025, where the company posted total revenues of $439.7 million. The consolidated gross margin declined to 28 percent in Q2 2025, reflecting the industry-wide pricing pressure and sales mix issues noted, especially in the lower-margin areas.
Here's a quick look at the segment margin divergence in Q2 2025:
| Segment | Gross Margin (Q2 2025) | Operating Income (Q2 2025, $MM) |
| Fuel Specialties | 38.1% | $35.4 |
| Performance Chemicals | 17.5% | $14.3 |
| Oilfield Services | 29.6% | (Not specified in outline, but down 15%) |
The disparity in segment profitability highlights where competitive forces are most keenly felt. The company is prioritizing margin improvement in the second half of 2025.
The competitive landscape involves players with significant scale and resources, as seen in the general competitor data:
- Top competitors include Lubrizol, Afton Chemical, and Infineum.
- The competitive set includes large entities like BASF SE and Evonik Industries AG.
- Afton Chemical generates revenue that is greater than Innospec Inc.'s by $210.8M according to one comparison.
- The top 10 competitors average approximately 21,108 employees, compared to Innospec Inc.'s 2,450 employees (as of late 2024/early 2025 context).
The Fuel Specialties segment's margin strength suggests successful differentiation, possibly through non-fuel applications, which management noted as a benefit. Still, the overall consolidated margin pressure indicates that Innospec Inc. must continually fight for pricing power against these large, diversified chemical players. Finance: draft Q3 2025 margin recovery plan by next Tuesday.
Innospec Inc. (IOSP) - Porter's Five Forces: Threat of substitutes
You're looking at how external pressures could replace Innospec Inc.'s specialized chemical offerings. This force is definitely materializing across all three of Innospec Inc.'s core segments, driven by sustainability mandates and customer cost-control efforts.
In Oilfield Services, the substitution pressure comes from the push for 'green chemistry.' While Innospec Oilfield Services posted net sales of $99.1 million in Q3 2025, the industry trend is toward less environmentally impactful chemistries. Innospec is responding by launching products like the LaZuli™ line, certified for deepwater subsea production as of March 2025, and AquaBourne™, a water-based Friction Reducer that explicitly excludes oil or surfactants. This signals that customers are actively seeking alternatives to traditional synthetic scale inhibitors and friction reducers, making Innospec Inc.'s R&D a defensive necessity rather than just an offensive play.
For Performance Chemicals, the clean beauty trend is forcing a direct substitution of traditional ingredients. The global surfactants market is valued at $43,914.5 million in 2025, and while synthetic surfactants still dominate with an 87.5% market share, the demand for sulfate-free and 1,4-dioxane-free alternatives is a clear substitution risk for Innospec Inc.'s formulations. This pressure is evident in the segment's profitability; its Q3 2025 gross margin contracted sharply to 15.1%, suggesting that either the cost to reformulate is high or customers are switching to less premium, perhaps substitute, options.
The most significant long-term substitute threat targets the entire Fuel Specialties segment, which remains a financial anchor for Innospec Inc., posting net sales of $172.0 million in Q3 2025. The global shift toward electric vehicles and renewable energy sources represents the ultimate substitution for the need for performance additives in internal combustion engine fuels. While this transition is gradual, the regulatory environment, such as the first FuelEU Maritime reporting period beginning in 2025, pushes for low-carbon fuels, which will eventually render current additive packages obsolete. For context, in the marine sector, biofuels currently account for only 0.6% of global biofuels consumption, showing the scale of the transition required.
Finally, customers across all segments retain the option to substitute Innospec Inc.'s specialized, high-value-add products with in-house blending or lower-cost generic additives to manage expenses. This is a constant baseline threat. The fact that Innospec Inc. generated only $39.3 million in operating cash inflow in Q3 2025, while corporate costs rose to $18.2 million, highlights the constant need to defend pricing against customers looking to capture margin through self-supply or cheaper inputs.
Here are some key figures illustrating the market dynamics you are facing:
- Q3 2025 Fuel Specialties net sales: $172.0 million.
- Q3 2025 Oilfield Services net sales: $99.1 million.
- Global Surfactants Market Size (2025): $43,914.5 million.
- Synthetic Surfactants Market Share (2025): 87.5%.
- Innospec's Net Cash position (Q3 2025): $270.8 million.
The competitive landscape for Innospec Inc. is defined by these external pressures, which are best summarized by the following segment and market metrics:
| Segment/Market Indicator | Metric/Value | Period/Context |
|---|---|---|
| Fuel Specialties Net Sales | $172.0 million | Q3 2025 |
| Oilfield Services Net Sales | $99.1 million | Q3 2025 |
| Performance Chemicals Gross Margin | 15.1% | Q3 2025 |
| Global Surfactants Market Size | $43,914.5 million | 2025 Estimate |
| North America Surfactants Market Share | Over 40% | 2025 Estimate |
| Synthetic Surfactants Market Share | 87.5% | 2025 Estimate |
| Biobased Marine Fuel Consumption | 0.6% | Current (Relative to total consumption) |
You need to watch how quickly the market moves away from the incumbent chemistries. If onboarding takes 14+ days, churn risk rises due to readily available generic substitutes.
Finance: draft 13-week cash view by Friday.
Innospec Inc. (IOSP) - Porter's Five Forces: Threat of new entrants
You're looking at the barriers to entry for Innospec Inc. (IOSP), and honestly, the deck is stacked against newcomers, especially in their core specialty chemical segments. The sheer scale of operation Innospec maintains acts as a massive deterrent.
Global Footprint and Capital Intensity
Building a comparable global manufacturing and Research & Technology (R&T) network requires substantial upfront capital. Innospec operates with manufacturing plants, research centers, and facilities across 22 countries in the Americas, Europe, the Middle East, Africa, and Asia Pacific. To support this, capital expenditures are a constant drain, which a new entrant must match or exceed. For instance, Innospec reported capital expenditures of $22.2 million in the third quarter of 2025 alone. Full-year 2024 cash from operations after capital expenditures was $122.7 million, showing the level of ongoing investment required just to maintain the existing base.
Here's a quick look at the scale of investment Innospec is making:
| Metric | Value (Latest Available Data) | Context |
|---|---|---|
| Global Operating Countries | 22 | Innospec's global manufacturing and R&D network presence |
| Q3 2025 Capital Expenditures | $22.2 million | Cash spent on assets during the third quarter of 2025 |
| GDI Engine Penetration (New Vehicles) | More than half | Percentage of new cars and light trucks powered by GDI engines, driving demand for specialized additives |
What this estimate hides is the sunk cost in existing, specialized production lines that a new firm cannot easily replicate.
Regulatory Hurdles and Compliance Costs
Significant regulatory barriers definitely exist, especially within the Fuel Specialties segment. New fuel additive chemistries require extensive, costly testing and official approvals to meet increasingly stringent global emission standards. Governments worldwide enforce rigorous standards, such as the European Environment Agency's Euro 6d standards, which limit particulate numbers to 6×10¹¹ particles/km. To comply, refiners must use high-performance additives, forcing new entrants to navigate complex compliance pathways. The global fuel additives market was valued at $9.41 billion in 2025, but accessing it means absorbing high costs associated with testing and certification to meet evolving requirements.
Intellectual Property Moats
Entrants face high intellectual property (IP) barriers in Innospec's specialized, high-value areas. In the Oilfield Services segment, Innospec is expanding production for its proprietary Drag Reducing Agent (DRA) technologies, with new capacity expected to come online in the fourth quarter of 2025. This proprietary nature means competitors cannot simply copy the technology that offers pipeline operators increased throughput and lower operating costs. Also, in Fuel Specialties, the shift to Gasoline Direct Injection (GDI) engines-now powering more than half of new cars and light trucks-requires specific additive solutions like Innospec's Dynamico technology, which was specifically designed for these high-tolerance engines. Developing a competitive, non-infringing GDI additive requires significant, targeted R&D investment.
Customer Relationship Stickiness
The need for deep, long-standing customer relationships with major refiners and oilfield operators is a major hurdle. Innospec emphasizes its 'world-class customer service' and 'best-in-class technical solutions' as key to its success in Fuel Specialties and Oilfield Services. These relationships are built on years of trust, proven performance, and integration into the customer's complex operational processes, such as meeting nationwide quality standards like TOP TIER™ in the U.S.. Breaking into these established supply chains requires more than just a competitive price; it demands a proven track record of reliability that only time and successful deployments can build. If onboarding takes 14+ days, churn risk rises, and for a new entrant, establishing that initial trust is the hardest part.
Disclaimer
All information, articles, and product details provided on this website are for general informational and educational purposes only. We do not claim any ownership over, nor do we intend to infringe upon, any trademarks, copyrights, logos, brand names, or other intellectual property mentioned or depicted on this site. Such intellectual property remains the property of its respective owners, and any references here are made solely for identification or informational purposes, without implying any affiliation, endorsement, or partnership.
We make no representations or warranties, express or implied, regarding the accuracy, completeness, or suitability of any content or products presented. Nothing on this website should be construed as legal, tax, investment, financial, medical, or other professional advice. In addition, no part of this site—including articles or product references—constitutes a solicitation, recommendation, endorsement, advertisement, or offer to buy or sell any securities, franchises, or other financial instruments, particularly in jurisdictions where such activity would be unlawful.
All content is of a general nature and may not address the specific circumstances of any individual or entity. It is not a substitute for professional advice or services. Any actions you take based on the information provided here are strictly at your own risk. You accept full responsibility for any decisions or outcomes arising from your use of this website and agree to release us from any liability in connection with your use of, or reliance upon, the content or products found herein.