
|
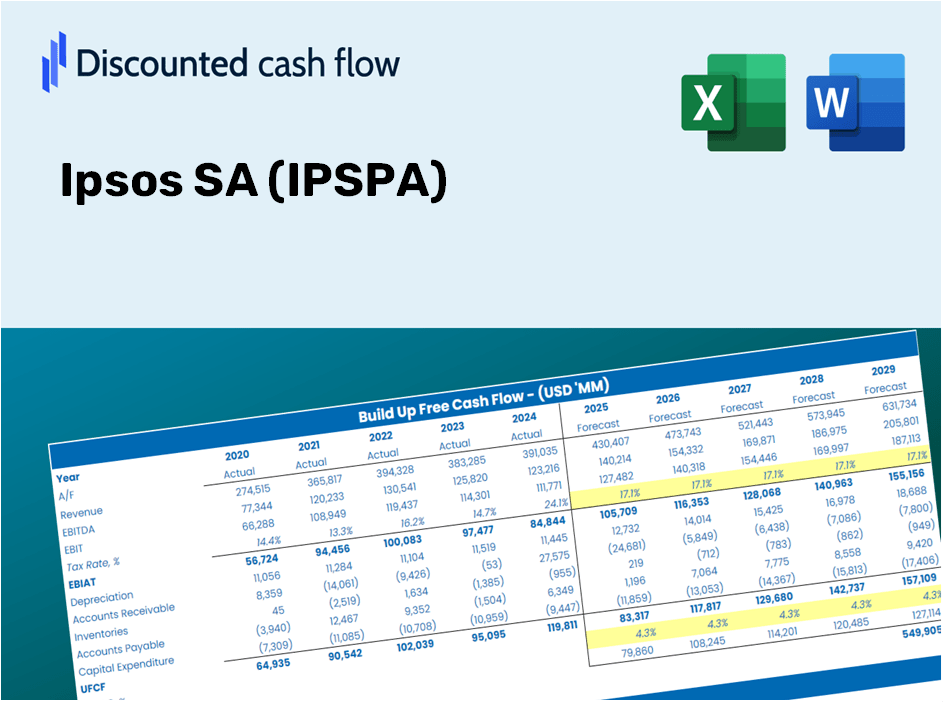
IPSOS SA (IPS.PA) Évaluation DCF |
Entièrement Modifiable: Adapté À Vos Besoins Dans Excel Ou Sheets
Conception Professionnelle: Modèles Fiables Et Conformes Aux Normes Du Secteur
Pré-Construits Pour Une Utilisation Rapide Et Efficace
Compatible MAC/PC, entièrement débloqué
Aucune Expertise N'Est Requise; Facile À Suivre
Ipsos SA (IPS.PA) Bundle
Gagnez du temps et améliorez la précision avec notre calculatrice DCF (IPSPA)! Équipée de vraies données IPSOS SA et des hypothèses personnalisables, cet outil vous permet de prévoir, analyser et valoriser Ipsos SA comme un investisseur chevronné.
What You Will Receive
- Authentic IPSA Financial Data: Pre-loaded with Ipsos SA's historical and forecasted data for accurate analysis.
- Completely Customizable Template: Effortlessly adjust key metrics such as revenue growth, WACC, and EBITDA %.
- Real-Time Calculations: Watch as Ipsos SA's intrinsic value refreshes instantly with your modifications.
- Expert Valuation Tool: Tailored for investors, analysts, and consultants aiming for precise DCF results.
- Intuitive Design: Streamlined layout and straightforward instructions for users of all experience levels.
Key Features
- Authentic Ipsos Financial Data: Gain access to reliable pre-loaded historical figures and future forecasts.
- Adjustable Forecast Parameters: Modify highlighted cells for key metrics such as WACC, growth rates, and profit margins.
- Real-Time Calculations: Automatic updates for DCF, Net Present Value (NPV), and cash flow evaluations.
- User-Friendly Dashboard: Clear charts and summaries to help you visualize your valuation outcomes.
- Designed for Everyone: An intuitive layout tailored for investors, CFOs, and consultants alike.
How It Operates
- 1. Access the Template: Download the Excel file featuring Ipsos SA’s (IPSPA) preloaded data.
- 2. Modify Assumptions: Adjust critical inputs such as growth rates, WACC, and capital expenditures.
- 3. View Instant Results: The DCF model automatically calculates the intrinsic value and NPV.
- 4. Explore Scenarios: Analyze various forecasts to evaluate different valuation results.
- 5. Utilize With Assurance: Present expert valuation insights to bolster your decision-making.
Why Choose This Calculator for Ipsos SA (IPSPA)?
- Designed for Experts: A sophisticated tool utilized by market analysts, CFOs, and strategic consultants.
- Accurate Market Data: Ipsos’ historical and projected financial information is preloaded to ensure precision.
- Flexible Scenario Analysis: Effortlessly simulate various forecasts and assumptions.
- Detailed Outputs: Automatically computes intrinsic value, NPV, and other critical metrics.
- User-Friendly: Step-by-step guidance makes the process straightforward for everyone.
Who Can Benefit from Ipsos SA (IPSPA)?
- Individual Investors: Gain insights to make educated decisions on buying or selling shares of Ipsos SA (IPSPA).
- Market Analysts: Enhance analysis with accessible data and market research tools specific to Ipsos SA (IPSPA).
- Consultants: Provide clients with timely and precise insights on Ipsos SA (IPSPA) valuations.
- Business Owners: Learn how a leading company like Ipsos SA (IPSPA) is valued to inform your own business strategies.
- Students of Finance: Explore valuation methodologies through practical applications using real data related to Ipsos SA (IPSPA).
Contents of the Template
- Pre-Filled Data: Features Ipsos SA’s historical financial information and future projections.
- Discounted Cash Flow Model: A customizable DCF valuation model with real-time calculations.
- Weighted Average Cost of Capital (WACC): A specialized sheet for WACC calculation based on user-defined inputs.
- Key Financial Ratios: Evaluate Ipsos SA’s profitability, operational efficiency, and financial leverage.
- Customizable Inputs: Easily adjust revenue growth rates, profit margins, and tax assumptions.
- Clear Dashboard: Visual representations and tables that highlight essential valuation outcomes.
Disclaimer
All information, articles, and product details provided on this website are for general informational and educational purposes only. We do not claim any ownership over, nor do we intend to infringe upon, any trademarks, copyrights, logos, brand names, or other intellectual property mentioned or depicted on this site. Such intellectual property remains the property of its respective owners, and any references here are made solely for identification or informational purposes, without implying any affiliation, endorsement, or partnership.
We make no representations or warranties, express or implied, regarding the accuracy, completeness, or suitability of any content or products presented. Nothing on this website should be construed as legal, tax, investment, financial, medical, or other professional advice. In addition, no part of this site—including articles or product references—constitutes a solicitation, recommendation, endorsement, advertisement, or offer to buy or sell any securities, franchises, or other financial instruments, particularly in jurisdictions where such activity would be unlawful.
All content is of a general nature and may not address the specific circumstances of any individual or entity. It is not a substitute for professional advice or services. Any actions you take based on the information provided here are strictly at your own risk. You accept full responsibility for any decisions or outcomes arising from your use of this website and agree to release us from any liability in connection with your use of, or reliance upon, the content or products found herein.