
|
Jack In the Box Inc. (Jack) Valation DCF |
Entièrement Modifiable: Adapté À Vos Besoins Dans Excel Ou Sheets
Conception Professionnelle: Modèles Fiables Et Conformes Aux Normes Du Secteur
Pré-Construits Pour Une Utilisation Rapide Et Efficace
Compatible MAC/PC, entièrement débloqué
Aucune Expertise N'Est Requise; Facile À Suivre
Jack in the Box Inc. (JACK) Bundle
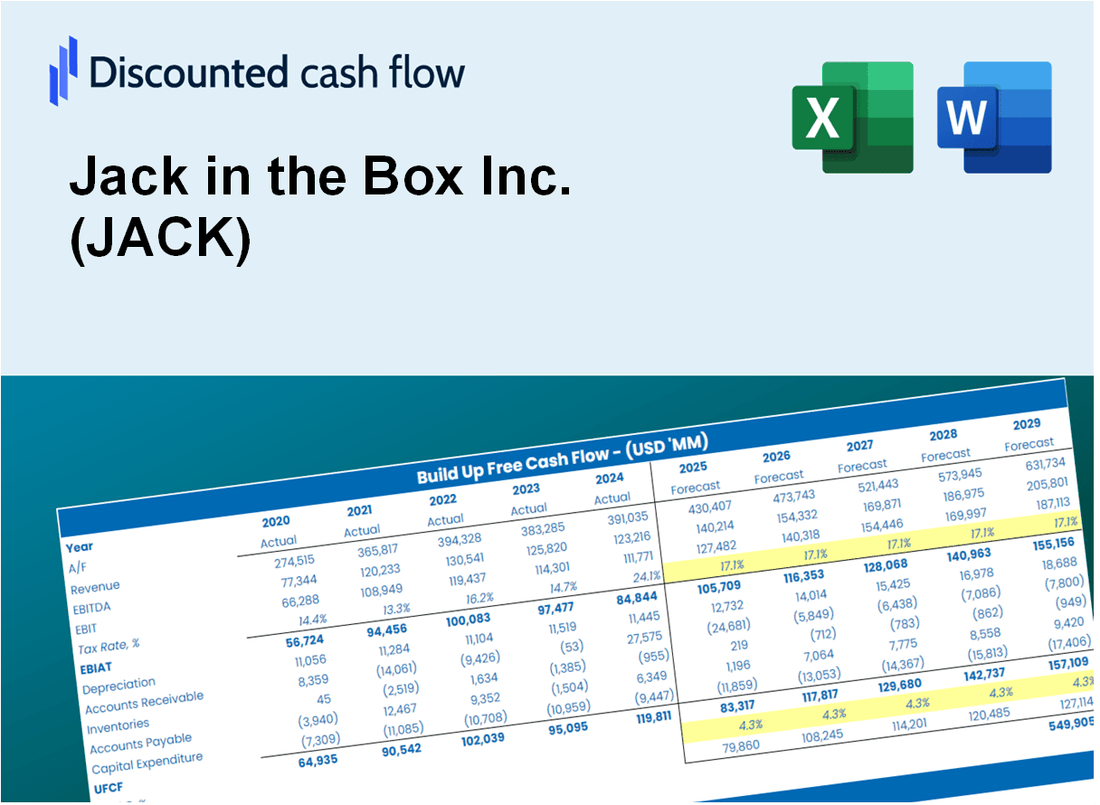
Que vous soyez un investisseur ou un analyste, cette calculatrice DCF (Jack) est votre outil essentiel pour une évaluation précise. Préchargé avec Jack In the Box Inc. Data réel, vous pouvez ajuster les prévisions et observer les effets en temps réel.
Discounted Cash Flow (DCF) - (USD MM)
| Year | AY1 2020 |
AY2 2021 |
AY3 2022 |
AY4 2023 |
AY5 2024 |
FY1 2025 |
FY2 2026 |
FY3 2027 |
FY4 2028 |
FY5 2029 |
|---|---|---|---|---|---|---|---|---|---|---|
| Revenue | 1,021.5 | 1,143.7 | 1,468.1 | 1,692.3 | 1,571.3 | 1,761.6 | 1,975.0 | 2,214.2 | 2,482.4 | 2,783.1 |
| Revenue Growth, % | 0 | 11.96 | 28.37 | 15.27 | -7.15 | 12.11 | 12.11 | 12.11 | 12.11 | 12.11 |
| EBITDA | 241.9 | 337.2 | 304.1 | 336.8 | 138.3 | 361.4 | 405.2 | 454.2 | 509.3 | 570.9 |
| EBITDA, % | 23.68 | 29.48 | 20.71 | 19.9 | 8.8 | 20.51 | 20.51 | 20.51 | 20.51 | 20.51 |
| Depreciation | 52.8 | 46.5 | 56.1 | 62.3 | 60.5 | 72.5 | 81.3 | 91.2 | 102.2 | 114.6 |
| Depreciation, % | 5.17 | 4.07 | 3.82 | 3.68 | 3.85 | 4.12 | 4.12 | 4.12 | 4.12 | 4.12 |
| EBIT | 189.1 | 290.7 | 248.0 | 274.5 | 77.8 | 288.9 | 323.9 | 363.1 | 407.1 | 456.4 |
| EBIT, % | 18.51 | 25.41 | 16.89 | 16.22 | 4.95 | 16.4 | 16.4 | 16.4 | 16.4 | 16.4 |
| Total Cash | 199.7 | 55.3 | 108.9 | 157.7 | 24.7 | 150.4 | 168.6 | 189.1 | 212.0 | 237.6 |
| Total Cash, percent | .0 | .0 | .0 | .0 | .0 | .0 | .0 | .0 | .0 | .0 |
| Account Receivables | 78.4 | 74.3 | 103.8 | 99.7 | 83.6 | 114.3 | 128.2 | 143.7 | 161.1 | 180.7 |
| Account Receivables, % | 7.68 | 6.5 | 7.07 | 5.89 | 5.32 | 6.49 | 6.49 | 6.49 | 6.49 | 6.49 |
| Inventories | 1.8 | 2.3 | 5.3 | 3.9 | 3.9 | 4.3 | 4.8 | 5.4 | 6.1 | 6.8 |
| Inventories, % | 0.17699 | 0.20417 | 0.35856 | 0.23022 | 0.2496 | 0.24391 | 0.24391 | 0.24391 | 0.24391 | 0.24391 |
| Accounts Payable | 31.1 | 29.1 | 66.3 | 85.0 | 69.5 | 68.9 | 77.2 | 86.6 | 97.1 | 108.8 |
| Accounts Payable, % | 3.05 | 2.55 | 4.51 | 5.02 | 4.42 | 3.91 | 3.91 | 3.91 | 3.91 | 3.91 |
| Capital Expenditure | -19.5 | -41.0 | -46.5 | -75.0 | -115.5 | -72.0 | -80.7 | -90.5 | -101.5 | -113.8 |
| Capital Expenditure, % | -1.91 | -3.59 | -3.17 | -4.43 | -7.35 | -4.09 | -4.09 | -4.09 | -4.09 | -4.09 |
| Tax Rate, % | -748.83 | -748.83 | -748.83 | -748.83 | -748.83 | -748.83 | -748.83 | -748.83 | -748.83 | -748.83 |
| EBITAT | 139.0 | 217.4 | 177.3 | 189.7 | 660.5 | 224.7 | 251.9 | 282.4 | 316.6 | 355.0 |
| Depreciation | ||||||||||
| Changes in Account Receivables | ||||||||||
| Changes in Inventories | ||||||||||
| Changes in Accounts Payable | ||||||||||
| Capital Expenditure | ||||||||||
| UFCF | 123.1 | 224.5 | 191.7 | 201.2 | 606.1 | 193.4 | 246.4 | 276.3 | 309.8 | 347.3 |
| WACC, % | 3.31 | 3.35 | 3.24 | 3.15 | 4.21 | 3.45 | 3.45 | 3.45 | 3.45 | 3.45 |
| PV UFCF | ||||||||||
| SUM PV UFCF | 1,230.3 | |||||||||
| Long Term Growth Rate, % | 1.00 | |||||||||
| Free cash flow (T + 1) | 351 | |||||||||
| Terminal Value | 14,306 | |||||||||
| Present Terminal Value | 12,074 | |||||||||
| Enterprise Value | 13,304 | |||||||||
| Net Debt | 3,159 | |||||||||
| Equity Value | 10,145 | |||||||||
| Diluted Shares Outstanding, MM | 20 | |||||||||
| Equity Value Per Share | 511.45 |
What You Will Get
- Editable Excel Template: A fully customizable Excel-based DCF Calculator featuring pre-filled real JACK financials.
- Real-World Data: Historical data and forward-looking estimates (as indicated in the yellow cells).
- Forecast Flexibility: Adjust forecast assumptions such as revenue growth, EBITDA %, and WACC.
- Automatic Calculations: Instantly observe the effect of your inputs on Jack in the Box's valuation.
- Professional Tool: Designed for investors, CFOs, consultants, and financial analysts.
- User-Friendly Design: Organized for clarity and ease of use, complete with step-by-step instructions.
Key Features
- Real Jack in the Box Financials: Access precise pre-loaded historical data and future forecasts.
- Customizable Forecast Assumptions: Modify yellow-highlighted cells such as WACC, growth rates, and profit margins.
- Dynamic Calculations: Automatic updates to DCF, Net Present Value (NPV), and cash flow analysis.
- Visual Dashboard: User-friendly charts and summaries to illustrate your valuation outcomes.
- For Professionals and Beginners: An intuitive design tailored for investors, CFOs, and consultants.
How It Works
- Download: Access the comprehensive Excel file featuring Jack in the Box Inc.'s (JACK) financial data.
- Customize: Tailor your forecasts, including sales growth, EBITDA %, and WACC.
- Update Automatically: The intrinsic value and NPV calculations refresh in real-time.
- Test Scenarios: Develop various projections and compare results instantly.
- Make Decisions: Utilize the valuation outcomes to inform your investment strategy.
Why Choose This Calculator for Jack in the Box Inc. (JACK)?
- User-Friendly Design: Suitable for both novices and seasoned analysts.
- Customizable Inputs: Adjust parameters easily to tailor your financial analysis.
- Real-Time Feedback: Watch Jack in the Box's valuation update instantly as you change inputs.
- Preloaded Data: Comes with Jack in the Box's actual financial metrics for swift evaluations.
- Relied Upon by Experts: Favored by investors and financial analysts for making educated decisions.
Who Should Use This Product?
- Investors: Evaluate Jack in the Box Inc.’s (JACK) financial health prior to making investment decisions.
- CFOs and Financial Analysts: Enhance valuation methodologies and assess future growth forecasts.
- Startup Founders: Gain insights into the valuation methods of established fast-food brands like Jack in the Box Inc. (JACK).
- Consultants: Create comprehensive valuation reports for your clientele focused on the fast-food industry.
- Students and Educators: Utilize real data from Jack in the Box Inc. (JACK) to learn and teach valuation practices.
What the Template Contains
- Pre-Filled Data: Includes Jack in the Box Inc.'s (JACK) historical financials and forecasts.
- Discounted Cash Flow Model: Editable DCF valuation model with automatic calculations.
- Weighted Average Cost of Capital (WACC): A dedicated sheet for calculating WACC based on custom inputs.
- Key Financial Ratios: Analyze Jack in the Box Inc.'s (JACK) profitability, efficiency, and leverage.
- Customizable Inputs: Edit revenue growth, margins, and tax rates with ease.
- Clear Dashboard: Charts and tables summarizing key valuation results.
Disclaimer
All information, articles, and product details provided on this website are for general informational and educational purposes only. We do not claim any ownership over, nor do we intend to infringe upon, any trademarks, copyrights, logos, brand names, or other intellectual property mentioned or depicted on this site. Such intellectual property remains the property of its respective owners, and any references here are made solely for identification or informational purposes, without implying any affiliation, endorsement, or partnership.
We make no representations or warranties, express or implied, regarding the accuracy, completeness, or suitability of any content or products presented. Nothing on this website should be construed as legal, tax, investment, financial, medical, or other professional advice. In addition, no part of this site—including articles or product references—constitutes a solicitation, recommendation, endorsement, advertisement, or offer to buy or sell any securities, franchises, or other financial instruments, particularly in jurisdictions where such activity would be unlawful.
All content is of a general nature and may not address the specific circumstances of any individual or entity. It is not a substitute for professional advice or services. Any actions you take based on the information provided here are strictly at your own risk. You accept full responsibility for any decisions or outcomes arising from your use of this website and agree to release us from any liability in connection with your use of, or reliance upon, the content or products found herein.