
|
Jai Balaji Industries Limited (Jaibalaji.NS) Valation DCF |
Entièrement Modifiable: Adapté À Vos Besoins Dans Excel Ou Sheets
Conception Professionnelle: Modèles Fiables Et Conformes Aux Normes Du Secteur
Pré-Construits Pour Une Utilisation Rapide Et Efficace
Compatible MAC/PC, entièrement débloqué
Aucune Expertise N'Est Requise; Facile À Suivre
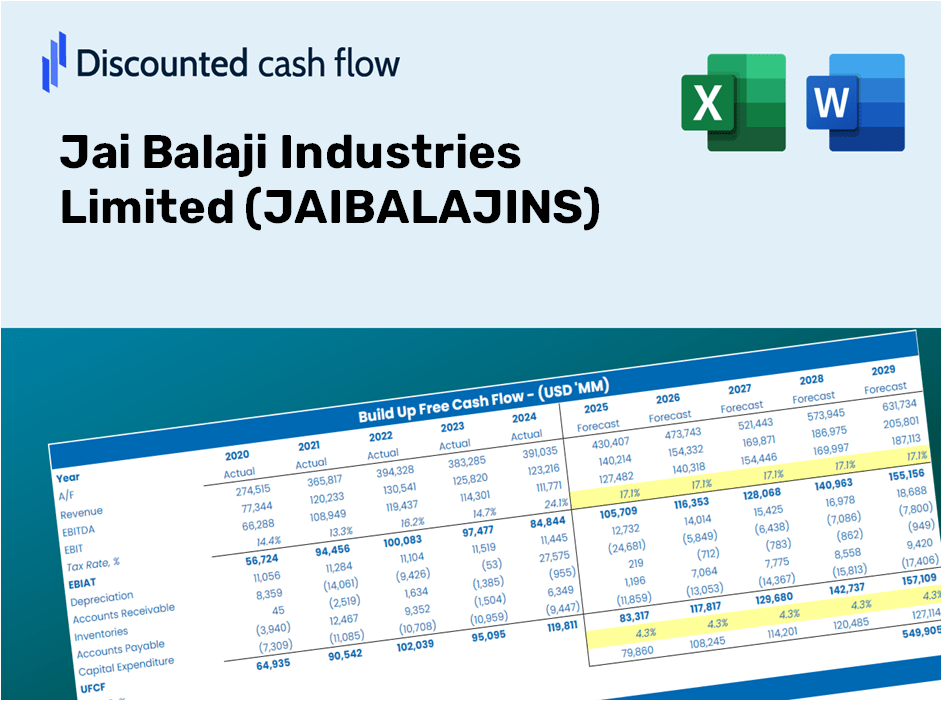
Jai Balaji Industries Limited (JAIBALAJI.NS) Bundle
Vous cherchez à évaluer la valeur intrinsèque de Jai Balaji Industries Limited? Notre calculatrice DCF (Jaibalajins) intègre des données réelles avec des fonctionnalités de personnalisation approfondies, vous permettant d'ajuster les prévisions et d'améliorer vos choix d'investissement.
Discounted Cash Flow (DCF) - (USD MM)
| Year | AY1 2021 |
AY2 2022 |
AY3 2023 |
AY4 2024 |
AY5 2025 |
FY1 2026 |
FY2 2027 |
FY3 2028 |
FY4 2029 |
FY5 2030 |
|---|---|---|---|---|---|---|---|---|---|---|
| Revenue | 27,851.8 | 46,925.0 | 61,250.7 | 64,137.8 | 63,508.0 | 79,820.3 | 100,322.4 | 126,090.6 | 158,477.5 | 199,183.0 |
| Revenue Growth, % | 0 | 68.48 | 30.53 | 4.71 | -0.98195 | 25.69 | 25.69 | 25.69 | 25.69 | 25.69 |
| EBITDA | 1,056.5 | 2,381.9 | 2,917.4 | 11,213.5 | 9,344.4 | 7,316.3 | 9,195.5 | 11,557.4 | 14,525.9 | 18,257.0 |
| EBITDA, % | 3.79 | 5.08 | 4.76 | 17.48 | 14.71 | 9.17 | 9.17 | 9.17 | 9.17 | 9.17 |
| Depreciation | 939.9 | 913.2 | 979.3 | 856.2 | 937.9 | 1,553.6 | 1,952.6 | 2,454.1 | 3,084.5 | 3,876.7 |
| Depreciation, % | 3.37 | 1.95 | 1.6 | 1.33 | 1.48 | 1.95 | 1.95 | 1.95 | 1.95 | 1.95 |
| EBIT | 116.6 | 1,468.7 | 1,938.1 | 10,357.3 | 8,406.5 | 5,762.7 | 7,242.9 | 9,103.3 | 11,441.5 | 14,380.3 |
| EBIT, % | 0.41855 | 3.13 | 3.16 | 16.15 | 13.24 | 7.22 | 7.22 | 7.22 | 7.22 | 7.22 |
| Total Cash | 256.4 | 163.5 | 344.9 | 536.2 | 1,437.9 | 787.4 | 989.6 | 1,243.8 | 1,563.3 | 1,964.8 |
| Total Cash, percent | .0 | .0 | .0 | .0 | .0 | .0 | .0 | .0 | .0 | .0 |
| Account Receivables | 2,440.1 | 1,561.4 | 2,293.1 | 2,450.2 | 4,302.8 | 4,218.9 | 5,302.6 | 6,664.6 | 8,376.4 | 10,527.9 |
| Account Receivables, % | 8.76 | 3.33 | 3.74 | 3.82 | 6.78 | 5.29 | 5.29 | 5.29 | 5.29 | 5.29 |
| Inventories | 6,991.6 | 7,580.3 | 8,213.7 | 9,497.1 | 12,482.1 | 14,228.5 | 17,883.2 | 22,476.6 | 28,249.8 | 35,505.8 |
| Inventories, % | 25.1 | 16.15 | 13.41 | 14.81 | 19.65 | 17.83 | 17.83 | 17.83 | 17.83 | 17.83 |
| Accounts Payable | 7,503.3 | 8,187.0 | 8,989.5 | 8,704.8 | 7,135.9 | 13,389.3 | 16,828.4 | 21,150.9 | 26,583.6 | 33,411.7 |
| Accounts Payable, % | 26.94 | 17.45 | 14.68 | 13.57 | 11.24 | 16.77 | 16.77 | 16.77 | 16.77 | 16.77 |
| Capital Expenditure | -421.7 | -1,273.2 | -924.5 | -3,813.4 | -3,577.9 | -2,764.3 | -3,474.3 | -4,366.7 | -5,488.4 | -6,898.1 |
| Capital Expenditure, % | -1.51 | -2.71 | -1.51 | -5.95 | -5.63 | -3.46 | -3.46 | -3.46 | -3.46 | -3.46 |
| Tax Rate, % | 28.29 | 28.29 | 28.29 | 28.29 | 28.29 | 28.29 | 28.29 | 28.29 | 28.29 | 28.29 |
| EBITAT | 116.6 | 1,468.8 | 1,068.1 | 9,457.9 | 6,028.1 | 4,819.2 | 6,057.0 | 7,612.8 | 9,568.2 | 12,025.8 |
| Depreciation | ||||||||||
| Changes in Account Receivables | ||||||||||
| Changes in Inventories | ||||||||||
| Changes in Accounts Payable | ||||||||||
| Capital Expenditure | ||||||||||
| UFCF | -1,293.6 | 2,082.6 | 560.3 | 4,775.6 | -3,018.4 | 8,199.3 | 3,236.1 | 4,067.3 | 5,112.0 | 6,425.0 |
| WACC, % | 5.05 | 5.05 | 4.75 | 4.99 | 4.86 | 4.94 | 4.94 | 4.94 | 4.94 | 4.94 |
| PV UFCF | ||||||||||
| SUM PV UFCF | 23,533.8 | |||||||||
| Long Term Growth Rate, % | 3.00 | |||||||||
| Free cash flow (T + 1) | 6,618 | |||||||||
| Terminal Value | 340,737 | |||||||||
| Present Terminal Value | 267,713 | |||||||||
| Enterprise Value | 291,246 | |||||||||
| Net Debt | 4,639 | |||||||||
| Equity Value | 286,607 | |||||||||
| Diluted Shares Outstanding, MM | 912 | |||||||||
| Equity Value Per Share | 314.18 |
What You Will Receive
- Customizable Excel Template: A fully editable Excel-based DCF Calculator featuring pre-loaded financial data for JAIBALAJINS (JAIBALAJINS).
- Comprehensive Data: Access to historical figures and projected estimates (highlighted in the yellow cells).
- Flexible Forecasting: Adjust key assumptions such as revenue growth, EBITDA percentage, and WACC easily.
- Instant Calculations: Quickly observe how your changes affect the valuation of Jai Balaji Industries Limited.
- Professional Resource: Designed for investors, CFOs, consultants, and financial professionals.
- User-Friendly Interface: Organized for straightforward navigation, complete with detailed instructions.
Key Features
- Comprehensive DCF Calculator: Offers detailed unlevered and levered DCF valuation models tailored for Jai Balaji Industries Limited (JAIBALAJINS).
- WACC Calculator: Features a ready-to-use Weighted Average Cost of Capital sheet with adjustable inputs.
- Customizable Forecast Assumptions: Easily alter growth rates, capital expenditures, and discount rates to suit your analysis.
- Integrated Financial Ratios: Evaluate profitability, leverage, and efficiency ratios specifically for Jai Balaji Industries Limited (JAIBALAJINS).
- Visualization Dashboard and Charts: Provides visual outputs that highlight essential valuation metrics for straightforward analysis.
How It Works
- Step 1: Download the Excel file.
- Step 2: Examine Jai Balaji Industries Limited’s (JAIBALAJINS) pre-filled financial data and projections.
- Step 3: Adjust key inputs such as revenue growth, WACC, and tax rates (cells highlighted for easy identification).
- Step 4: Observe the DCF model refresh in real time as you make changes to the assumptions.
- Step 5: Evaluate the results and utilize them to inform your investment strategies.
Why Opt for This Calculator?
- User-Friendly and Accessible: Suitable for both novices and seasoned professionals.
- Customizable Parameters: Easily adjust inputs to suit your analytical needs.
- Real-Time Updates: Observe immediate changes to Jai Balaji Industries Limited's valuation as you alter inputs.
- Pre-configured: Comes equipped with Jai Balaji Industries Limited's actual financial data for swift assessments.
- Relied Upon by Experts: Utilized by investors and analysts for making well-informed choices.
Who Can Benefit from This Product?
- Finance Students: Master valuation techniques and practice with actual data.
- Academics: Integrate industry-standard models into your lectures or research projects.
- Investors: Validate your hypotheses and evaluate valuation results for Jai Balaji Industries Limited (JAIBALAJINS).
- Analysts: Enhance your efficiency with a ready-to-use, customizable DCF model.
- Small Business Owners: Discover how major public companies like Jai Balaji Industries Limited are assessed.
Contents of the Template
- Operating and Balance Sheet Data: Pre-filled historical data and forecasts for Jai Balaji Industries Limited (JAIBALAJINS), including revenue, EBITDA, EBIT, and capital expenditures.
- WACC Calculation: A dedicated worksheet for calculating the Weighted Average Cost of Capital (WACC), encompassing parameters such as Beta, risk-free rate, and share price.
- DCF Valuation (Unlevered and Levered): Customizable Discounted Cash Flow models that display intrinsic value along with comprehensive calculations.
- Financial Statements: Pre-loaded annual and quarterly financial statements to facilitate in-depth analysis.
- Key Ratios: A compilation of profitability, leverage, and efficiency ratios relevant to Jai Balaji Industries Limited (JAIBALAJINS).
- Dashboard and Charts: A visual overview of valuation outputs and underlying assumptions for streamlined result analysis.
Disclaimer
All information, articles, and product details provided on this website are for general informational and educational purposes only. We do not claim any ownership over, nor do we intend to infringe upon, any trademarks, copyrights, logos, brand names, or other intellectual property mentioned or depicted on this site. Such intellectual property remains the property of its respective owners, and any references here are made solely for identification or informational purposes, without implying any affiliation, endorsement, or partnership.
We make no representations or warranties, express or implied, regarding the accuracy, completeness, or suitability of any content or products presented. Nothing on this website should be construed as legal, tax, investment, financial, medical, or other professional advice. In addition, no part of this site—including articles or product references—constitutes a solicitation, recommendation, endorsement, advertisement, or offer to buy or sell any securities, franchises, or other financial instruments, particularly in jurisdictions where such activity would be unlawful.
All content is of a general nature and may not address the specific circumstances of any individual or entity. It is not a substitute for professional advice or services. Any actions you take based on the information provided here are strictly at your own risk. You accept full responsibility for any decisions or outcomes arising from your use of this website and agree to release us from any liability in connection with your use of, or reliance upon, the content or products found herein.