
|
The Karnataka Bank Limited (Ktkbank.NS) Valation DCF |
Entièrement Modifiable: Adapté À Vos Besoins Dans Excel Ou Sheets
Conception Professionnelle: Modèles Fiables Et Conformes Aux Normes Du Secteur
Pré-Construits Pour Une Utilisation Rapide Et Efficace
Compatible MAC/PC, entièrement débloqué
Aucune Expertise N'Est Requise; Facile À Suivre
The Karnataka Bank Limited (KTKBANK.NS) Bundle
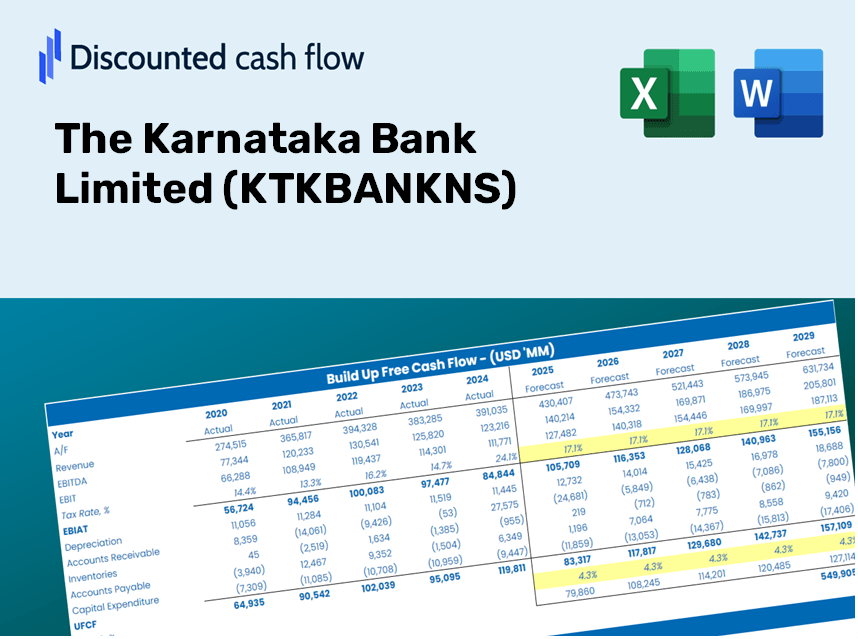
Gagnez la maîtrise sur votre analyse d'évaluation de votre Karnataka Bank Limited (KTKBankns) à l'aide de notre calculatrice DCF de pointe! Équipée de données réelles (KTKBankns), ce modèle Excel vous permet d'ajuster les prévisions et les hypothèses pour déterminer avec précision la valeur intrinsèque de Karnataka Bank Limited.
Discounted Cash Flow (DCF) - (USD MM)
| Year | AY1 2021 |
AY2 2022 |
AY3 2023 |
AY4 2024 |
AY5 2025 |
FY1 2026 |
FY2 2027 |
FY3 2028 |
FY4 2029 |
FY5 2030 |
|---|---|---|---|---|---|---|---|---|---|---|
| Revenue | 22,910.5 | 71,663.9 | 34,105.0 | 96,174.7 | 102,831.7 | 142,553.5 | 197,619.1 | 273,955.5 | 379,779.0 | 526,480.1 |
| Revenue Growth, % | 0 | 212.8 | -52.41 | 182 | 6.92 | 38.63 | 38.63 | 38.63 | 38.63 | 38.63 |
| EBITDA | 6,853.4 | 7,676.1 | 12,661.2 | .0 | 17,262.4 | 26,953.0 | 37,364.4 | 51,797.5 | 71,805.9 | 99,543.1 |
| EBITDA, % | 29.91 | 10.71 | 37.12 | 0 | 16.79 | 18.91 | 18.91 | 18.91 | 18.91 | 18.91 |
| Depreciation | 735.2 | 736.7 | 864.4 | 718.8 | 851.1 | 2,379.7 | 3,299.0 | 4,573.3 | 6,339.9 | 8,788.9 |
| Depreciation, % | 3.21 | 1.03 | 2.53 | 0.74737 | 0.82766 | 1.67 | 1.67 | 1.67 | 1.67 | 1.67 |
| EBIT | 6,118.2 | 6,939.3 | 11,796.8 | -718.8 | 16,411.3 | 24,573.3 | 34,065.4 | 47,224.2 | 65,466.0 | 90,754.2 |
| EBIT, % | 26.7 | 9.68 | 34.59 | -0.74737 | 15.96 | 17.24 | 17.24 | 17.24 | 17.24 | 17.24 |
| Total Cash | 53,155.7 | 44,367.6 | 116,159.1 | 79,927.4 | 79,843.1 | 120,503.8 | 167,052.0 | 231,580.9 | 321,036.0 | 445,045.8 |
| Total Cash, percent | .0 | .0 | .0 | .0 | .0 | .0 | .0 | .0 | .0 | .0 |
| Account Receivables | 7,743.5 | 7,275.6 | 6,840.9 | 10,283.5 | .0 | 21,298.1 | 29,525.1 | 40,930.1 | 56,740.6 | 78,658.4 |
| Account Receivables, % | 33.8 | 10.15 | 20.06 | 10.69 | 0 | 14.94 | 14.94 | 14.94 | 14.94 | 14.94 |
| Inventories | .0 | -55,189.1 | -72,075.3 | .0 | .0 | -50,467.1 | -69,961.5 | -96,986.2 | -134,450.1 | -186,385.5 |
| Inventories, % | 0 | -77.01 | -211.33 | 0 | 0 | -35.4 | -35.4 | -35.4 | -35.4 | -35.4 |
| Accounts Payable | 605.3 | 683.4 | 897.2 | 907.4 | .0 | 2,044.1 | 2,833.7 | 3,928.4 | 5,445.8 | 7,549.4 |
| Accounts Payable, % | 2.64 | 0.95358 | 2.63 | 0.94349 | 0 | 1.43 | 1.43 | 1.43 | 1.43 | 1.43 |
| Capital Expenditure | -876.2 | -566.0 | -888.1 | -1,118.1 | -1,627.1 | -2,840.6 | -3,937.8 | -5,458.9 | -7,567.6 | -10,490.8 |
| Capital Expenditure, % | -3.82 | -0.78974 | -2.6 | -1.16 | -1.58 | -1.99 | -1.99 | -1.99 | -1.99 | -1.99 |
| Tax Rate, % | 22.44 | 22.44 | 22.44 | 22.44 | 22.44 | 22.44 | 22.44 | 22.44 | 22.44 | 22.44 |
| EBITAT | 4,824.6 | 5,080.0 | 9,661.0 | -600.9 | 12,728.4 | 19,418.4 | 26,919.3 | 37,317.7 | 51,732.8 | 71,716.2 |
| Depreciation | ||||||||||
| Changes in Account Receivables | ||||||||||
| Changes in Inventories | ||||||||||
| Changes in Accounts Payable | ||||||||||
| Capital Expenditure | ||||||||||
| UFCF | -2,454.7 | 60,985.9 | 27,172.0 | -76,507.9 | 21,328.5 | 50,170.7 | 38,337.5 | 53,146.5 | 73,675.9 | 102,135.5 |
| WACC, % | 57.34 | 53.59 | 59.36 | 60.49 | 56.48 | 57.45 | 57.45 | 57.45 | 57.45 | 57.45 |
| PV UFCF | ||||||||||
| SUM PV UFCF | 83,485.7 | |||||||||
| Long Term Growth Rate, % | 2.00 | |||||||||
| Free cash flow (T + 1) | 104,178 | |||||||||
| Terminal Value | 187,871 | |||||||||
| Present Terminal Value | 19,414 | |||||||||
| Enterprise Value | 102,900 | |||||||||
| Net Debt | -60,438 | |||||||||
| Equity Value | 163,337 | |||||||||
| Diluted Shares Outstanding, MM | 378 | |||||||||
| Equity Value Per Share | 431.56 |
What You Will Receive
- Authentic KTKBANK Financial Data: Pre-filled with Karnataka Bank’s historical and forecasted data for in-depth analysis.
- Completely Customizable Template: Easily adjust key inputs such as revenue growth, WACC, and EBITDA percentage.
- Instant Calculations: Watch as Karnataka Bank’s intrinsic value updates in real-time based on your modifications.
- Expert Valuation Tool: Crafted for investors, analysts, and consultants aiming for precise DCF results.
- Intuitive Interface: Clear layout and straightforward instructions suitable for all skill levels.
Key Features
- Advanced DCF Calculator: Features comprehensive unlevered and levered DCF valuation frameworks.
- WACC Calculator: Ready-to-use Weighted Average Cost of Capital sheet with adjustable inputs.
- Customizable Forecast Assumptions: Adjust growth rates, capital expenditures, and discount rates as needed.
- Integrated Financial Ratios: Evaluate profitability, leverage, and efficiency ratios specifically for Karnataka Bank Limited (KTKBANKNS).
- Visual Dashboard and Charts: Graphical representations of key valuation metrics for streamlined analysis.
How It Works
- Step 1: Download the prebuilt Excel template featuring Karnataka Bank’s data.
- Step 2: Navigate through the pre-filled sheets to familiarize yourself with the key metrics.
- Step 3: Modify forecasts and assumptions in the editable yellow cells (WACC, growth, margins).
- Step 4: Instantly access recalculated results, including Karnataka Bank’s intrinsic value.
- Step 5: Make well-informed investment decisions or create reports based on the outputs.
Why Opt for This Calculator?
- Reliable Data: Authentic Karnataka Bank financials provide trustworthy valuation outcomes.
- Tailorable: Modify essential parameters such as growth rates, WACC, and tax rates to align with your forecasts.
- Efficient: Built-in calculations save you from starting from scratch.
- Professional-Grade Resource: Crafted for investors, analysts, and financial consultants.
- User-Friendly Interface: An intuitive design and clear step-by-step guidance make it accessible for everyone.
Who Can Benefit from This Product?
- Investors: Assess the valuation of Karnataka Bank Limited (KTKBANKNS) prior to making investment decisions.
- CFOs and Financial Analysts: Enhance valuation methodologies and evaluate financial forecasts.
- Startup Founders: Understand the valuation processes of established banks like Karnataka Bank Limited (KTKBANKNS).
- Consultants: Prepare comprehensive valuation reports for your clients involving Karnataka Bank Limited (KTKBANKNS).
- Students and Educators: Utilize authentic data to practice and teach finance and valuation strategies.
What the Template Includes
- Comprehensive DCF Model: An editable template featuring detailed valuation calculations.
- Real-World Data: The Karnataka Bank Limited's (KTKBANKNS) historical and projected financials preloaded for thorough analysis.
- Customizable Parameters: Modify WACC, growth rates, and tax assumptions to explore various scenarios.
- Financial Statements: Complete annual and quarterly breakdowns for enhanced insights.
- Key Ratios: Integrated analysis for profitability, efficiency, and leverage metrics.
- Dashboard with Visual Outputs: Charts and tables providing clear and actionable results.
Disclaimer
All information, articles, and product details provided on this website are for general informational and educational purposes only. We do not claim any ownership over, nor do we intend to infringe upon, any trademarks, copyrights, logos, brand names, or other intellectual property mentioned or depicted on this site. Such intellectual property remains the property of its respective owners, and any references here are made solely for identification or informational purposes, without implying any affiliation, endorsement, or partnership.
We make no representations or warranties, express or implied, regarding the accuracy, completeness, or suitability of any content or products presented. Nothing on this website should be construed as legal, tax, investment, financial, medical, or other professional advice. In addition, no part of this site—including articles or product references—constitutes a solicitation, recommendation, endorsement, advertisement, or offer to buy or sell any securities, franchises, or other financial instruments, particularly in jurisdictions where such activity would be unlawful.
All content is of a general nature and may not address the specific circumstances of any individual or entity. It is not a substitute for professional advice or services. Any actions you take based on the information provided here are strictly at your own risk. You accept full responsibility for any decisions or outcomes arising from your use of this website and agree to release us from any liability in connection with your use of, or reliance upon, the content or products found herein.