
|
Dr Lal PathLabs Limited (LalpathLab.NS) Évaluation DCF |
Entièrement Modifiable: Adapté À Vos Besoins Dans Excel Ou Sheets
Conception Professionnelle: Modèles Fiables Et Conformes Aux Normes Du Secteur
Pré-Construits Pour Une Utilisation Rapide Et Efficace
Compatible MAC/PC, entièrement débloqué
Aucune Expertise N'Est Requise; Facile À Suivre
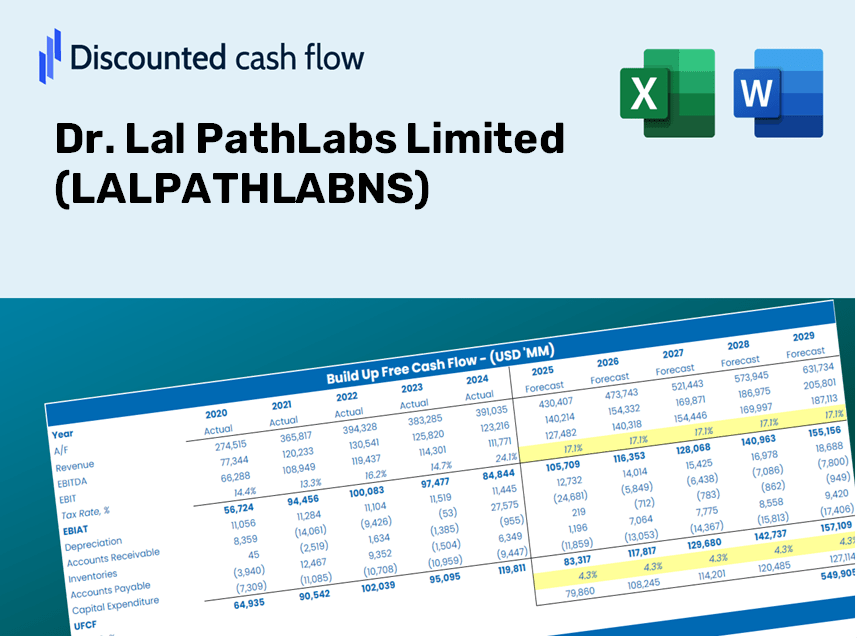
Dr. Lal PathLabs Limited (LALPATHLAB.NS) Bundle
Simplifiez l'évaluation du Dr Lal Pathlabs Limited (LalpathLabns) avec cette calculatrice DCF personnalisable! Avec le vrai Dr Lal PathLabs Limited (LalpathLabns) Financials and Adjustable Forecast Intarts, vous pouvez tester des scénarios et découvrir la juste valeur du Dr Lal Pathlabs Limited (LalPathLabns) en minutes.
Discounted Cash Flow (DCF) - (USD MM)
| Year | AY1 2021 |
AY2 2022 |
AY3 2023 |
AY4 2024 |
AY5 2025 |
FY1 2026 |
FY2 2027 |
FY3 2028 |
FY4 2029 |
FY5 2030 |
|---|---|---|---|---|---|---|---|---|---|---|
| Revenue | 15,812.7 | 20,874.1 | 20,168.8 | 22,266.4 | 24,614.0 | 27,664.4 | 31,093.0 | 34,946.4 | 39,277.4 | 44,145.2 |
| Revenue Growth, % | 0 | 32.01 | -3.38 | 10.4 | 10.54 | 12.39 | 12.39 | 12.39 | 12.39 | 12.39 |
| EBITDA | 3,988.7 | 5,188.5 | 4,412.3 | 5,672.6 | 6,579.3 | 6,869.9 | 7,721.3 | 8,678.2 | 9,753.7 | 10,962.5 |
| EBITDA, % | 25.22 | 24.86 | 21.88 | 25.48 | 26.73 | 24.83 | 24.83 | 24.83 | 24.83 | 24.83 |
| Depreciation | 390.9 | 641.4 | 1,010.8 | 991.1 | 986.4 | 1,052.1 | 1,182.5 | 1,329.0 | 1,493.7 | 1,678.8 |
| Depreciation, % | 2.47 | 3.07 | 5.01 | 4.45 | 4.01 | 3.8 | 3.8 | 3.8 | 3.8 | 3.8 |
| EBIT | 3,597.8 | 4,547.1 | 3,401.5 | 4,681.5 | 5,593.0 | 5,817.8 | 6,538.8 | 7,349.2 | 8,260.0 | 9,283.6 |
| EBIT, % | 22.75 | 21.78 | 16.87 | 21.02 | 22.72 | 21.03 | 21.03 | 21.03 | 21.03 | 21.03 |
| Total Cash | 9,840.3 | 6,816.6 | 8,143.1 | 9,426.0 | 11,654.0 | 12,445.7 | 13,988.1 | 15,721.7 | 17,670.1 | 19,860.0 |
| Total Cash, percent | .0 | .0 | .0 | .0 | .0 | .0 | .0 | .0 | .0 | .0 |
| Account Receivables | 912.2 | 1,063.9 | 937.8 | 1,101.5 | 1,238.3 | 1,410.5 | 1,585.3 | 1,781.8 | 2,002.6 | 2,250.8 |
| Account Receivables, % | 5.77 | 5.1 | 4.65 | 4.95 | 5.03 | 5.1 | 5.1 | 5.1 | 5.1 | 5.1 |
| Inventories | 425.6 | 525.4 | 338.0 | 373.1 | 361.0 | 554.8 | 623.5 | 700.8 | 787.6 | 885.2 |
| Inventories, % | 2.69 | 2.52 | 1.68 | 1.68 | 1.47 | 2.01 | 2.01 | 2.01 | 2.01 | 2.01 |
| Accounts Payable | 1,441.3 | 1,473.8 | 1,561.0 | 1,865.7 | 1,988.0 | 2,233.7 | 2,510.5 | 2,821.6 | 3,171.3 | 3,564.3 |
| Accounts Payable, % | 9.11 | 7.06 | 7.74 | 8.38 | 8.08 | 8.07 | 8.07 | 8.07 | 8.07 | 8.07 |
| Capital Expenditure | -595.9 | -4,761.4 | -446.0 | -511.7 | -443.0 | -1,819.6 | -2,045.2 | -2,298.6 | -2,583.5 | -2,903.7 |
| Capital Expenditure, % | -3.77 | -22.81 | -2.21 | -2.3 | -1.8 | -6.58 | -6.58 | -6.58 | -6.58 | -6.58 |
| Tax Rate, % | 22.03 | 22.03 | 22.03 | 22.03 | 22.03 | 22.03 | 22.03 | 22.03 | 22.03 | 22.03 |
| EBITAT | 2,660.2 | 3,301.1 | 2,363.0 | 3,313.3 | 4,360.7 | 4,244.0 | 4,770.0 | 5,361.2 | 6,025.6 | 6,772.4 |
| Depreciation | ||||||||||
| Changes in Account Receivables | ||||||||||
| Changes in Inventories | ||||||||||
| Changes in Accounts Payable | ||||||||||
| Capital Expenditure | ||||||||||
| UFCF | 2,558.7 | -1,037.9 | 3,328.4 | 3,898.7 | 4,901.7 | 3,356.1 | 3,940.6 | 4,429.0 | 4,977.9 | 5,594.8 |
| WACC, % | 4.57 | 4.57 | 4.57 | 4.57 | 4.57 | 4.57 | 4.57 | 4.57 | 4.57 | 4.57 |
| PV UFCF | ||||||||||
| SUM PV UFCF | 19,324.6 | |||||||||
| Long Term Growth Rate, % | 4.00 | |||||||||
| Free cash flow (T + 1) | 5,819 | |||||||||
| Terminal Value | 1,022,584 | |||||||||
| Present Terminal Value | 817,869 | |||||||||
| Enterprise Value | 837,194 | |||||||||
| Net Debt | -6,813 | |||||||||
| Equity Value | 844,007 | |||||||||
| Diluted Shares Outstanding, MM | 83 | |||||||||
| Equity Value Per Share | 10,117.80 |
What You Will Discover
- Authentic LALPATHLAB Financial Data: Pre-filled with Dr. Lal PathLabs’ historical and projected data for accurate analysis.
- Completely Customizable Template: Effortlessly adjust key inputs such as revenue growth, WACC, and EBITDA percentage.
- Instant Calculations: Observe immediate updates to Dr. Lal PathLabs’ intrinsic value based on your modifications.
- Professional Valuation Resource: Tailored for investors, analysts, and consultants pursuing precise DCF results.
- Intuitive Design: Clear structure and straightforward instructions suitable for all skill levels.
Key Features
- 🔍 Real-Life LALPATHLABNS Financials: Pre-filled historical and projected data for Dr. Lal PathLabs Limited.
- ✏️ Fully Customizable Inputs: Adjust all critical parameters (yellow cells) such as WACC, growth %, and tax rates.
- 📊 Professional DCF Valuation: Built-in formulas calculate Dr. Lal PathLabs Limited's intrinsic value using the Discounted Cash Flow method.
- ⚡ Instant Results: Visualize Dr. Lal PathLabs Limited's valuation instantly after making changes.
- Scenario Analysis: Test and compare outcomes for various financial assumptions side-by-side.
How It Functions
- Download: Obtain the pre-configured Excel file containing Dr. Lal PathLabs Limited’s financial data.
- Customize: Modify projections such as revenue growth, EBITDA %, and WACC as needed.
- Update Instantly: The intrinsic value and NPV calculations refresh in real-time.
- Analyze Scenarios: Generate various projections and compare the results immediately.
- Make Informed Choices: Utilize the valuation outcomes to shape your investment strategy for (LALPATHLABNS).
Why Choose This Calculator for Dr. Lal PathLabs Limited (LALPATHLABNS)?
- Precise Financials: Utilize actual financial data from Dr. Lal PathLabs for trustworthy valuation outcomes.
- Customizable Features: Modify essential inputs such as growth rates, WACC, and tax rates to align with your forecasts.
- Efficient Workflow: Built-in calculations streamline your process, saving you the hassle of starting from scratch.
- Expert-Level Tool: Tailored for investors, analysts, and consultants focusing on Dr. Lal PathLabs.
- Easy to Use: User-friendly design and clear, step-by-step guidance make it accessible to everyone.
Who Should Benefit from This Product?
- Investors: Accurately assess Dr. Lal PathLabs Limited’s fair value before making investment choices.
- CFOs: Utilize a professional-grade DCF model for precise financial reporting and analysis.
- Consultants: Easily modify the template for client valuation reports.
- Entrepreneurs: Acquire insights into financial modeling practices employed by leading healthcare companies.
- Educators: Employ it as a teaching resource to illustrate valuation methodologies.
What the Template Includes
- Extensive DCF Model: Editable template featuring thorough valuation calculations.
- Real-World Data: Preloaded historical and projected financials for Dr. Lal PathLabs Limited (LALPATHLABNS) to facilitate analysis.
- Customizable Parameters: Modify WACC, growth rates, and tax assumptions to explore different scenarios.
- Financial Statements: Complete annual and quarterly reports for in-depth insights.
- Key Ratios: Integrated analysis for profitability, efficiency, and leverage metrics.
- Dashboard with Visual Outputs: Charts and tables designed for clear, actionable insights.
Disclaimer
All information, articles, and product details provided on this website are for general informational and educational purposes only. We do not claim any ownership over, nor do we intend to infringe upon, any trademarks, copyrights, logos, brand names, or other intellectual property mentioned or depicted on this site. Such intellectual property remains the property of its respective owners, and any references here are made solely for identification or informational purposes, without implying any affiliation, endorsement, or partnership.
We make no representations or warranties, express or implied, regarding the accuracy, completeness, or suitability of any content or products presented. Nothing on this website should be construed as legal, tax, investment, financial, medical, or other professional advice. In addition, no part of this site—including articles or product references—constitutes a solicitation, recommendation, endorsement, advertisement, or offer to buy or sell any securities, franchises, or other financial instruments, particularly in jurisdictions where such activity would be unlawful.
All content is of a general nature and may not address the specific circumstances of any individual or entity. It is not a substitute for professional advice or services. Any actions you take based on the information provided here are strictly at your own risk. You accept full responsibility for any decisions or outcomes arising from your use of this website and agree to release us from any liability in connection with your use of, or reliance upon, the content or products found herein.