
|
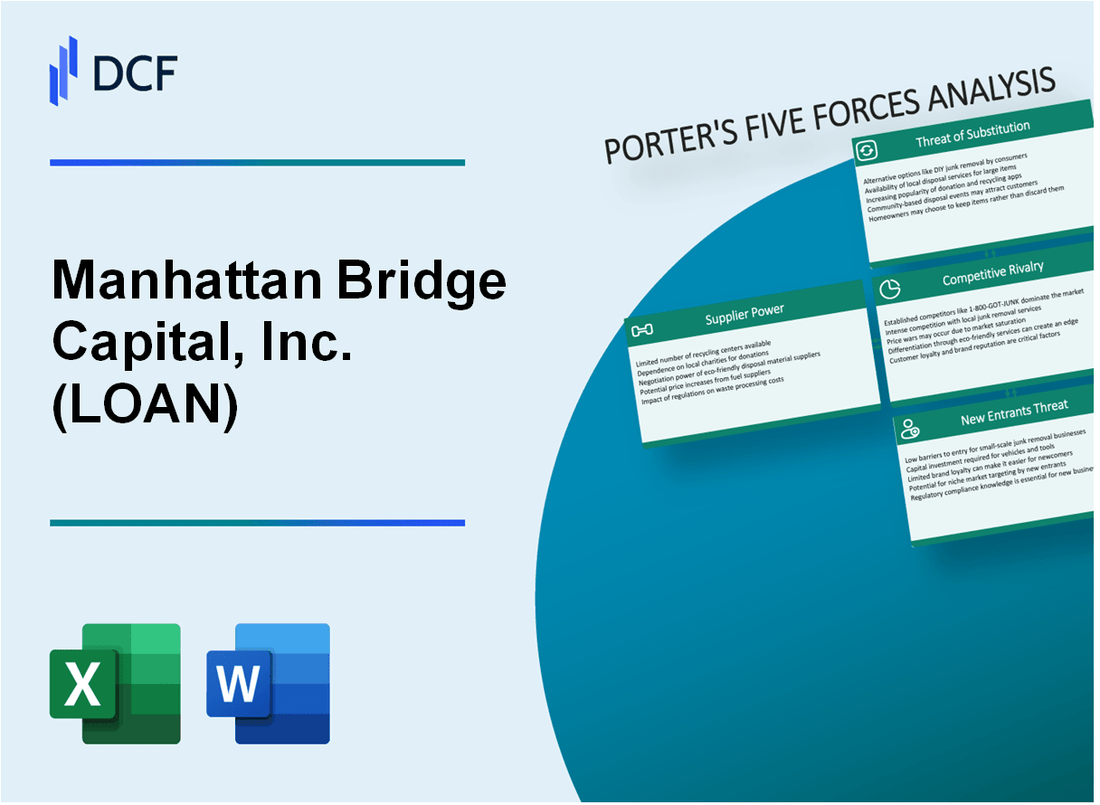
Manhattan Bridge Capital, Inc. (prêt): 5 Forces Analysis [Jan-2025 Mis à jour] |
Entièrement Modifiable: Adapté À Vos Besoins Dans Excel Ou Sheets
Conception Professionnelle: Modèles Fiables Et Conformes Aux Normes Du Secteur
Pré-Construits Pour Une Utilisation Rapide Et Efficace
Compatible MAC/PC, entièrement débloqué
Aucune Expertise N'Est Requise; Facile À Suivre
Manhattan Bridge Capital, Inc. (LOAN) Bundle
Dans le paysage dynamique des prêts commerciaux, Manhattan Bridge Capital, Inc. (prêt) navigue dans un écosystème complexe de forces compétitives qui façonnent son positionnement stratégique. En disséquant le cadre des cinq forces de Michael Porter, nous dévoilons la dynamique complexe de l'énergie des fournisseurs, la négociation des clients, la rivalité du marché, les menaces de substitution et les nouveaux entrants potentiels qui définissent la stratégie concurrentielle de l'entreprise dans le 2024 Marché financier. Cette analyse fournit un aperçu des défis et des opportunités stratégiques qui détermineront la capacité de Manhattan Bridge Capital à maintenir son avantage concurrentiel dans le secteur des prêts alternatifs en évolution rapide.
Manhattan Bridge Capital, Inc. (prêt) - Five Forces de Porter: Pouvoir de négociation des fournisseurs
Nombre limité de fournisseurs de technologies de prêt spécialisés
En 2024, le marché des technologies de prêt montre la concentration de fournisseurs suivante:
| Fournisseur | Part de marché | Revenus annuels |
|---|---|---|
| Mélanger les technologies | 23.4% | 412 millions de dollars |
| Ellie Mae | 19.7% | 348 millions de dollars |
| Englober | 16.5% | 276 millions de dollars |
Dépendance à l'égard des systèmes de données financières
Les principaux fournisseurs de données de notation du crédit et financiers:
- Experian: 38,2% de part de marché dans les rapports de crédit
- TransUnion: 31,5% de part de marché
- Equifax: 27,3% de part de marché
Coûts de commutation pour les systèmes opérationnels
Coûts de commutation estimés pour l'infrastructure de prêt de base:
| Type de système | Coût de commutation moyen | Temps de mise en œuvre |
|---|---|---|
| Plate-forme de prêt | $275,000 | 6-9 mois |
| Intégration de notation du crédit | $125,000 | 3-4 mois |
Marché concentré des fournisseurs d'infrastructures de prêt
Top 3 des fournisseurs d'infrastructures de prêt d'ici 2024 Metrics du marché:
- Black Knight: 1,2 milliard de dollars de revenus annuels
- Fiserv: 4,3 milliards de dollars de revenus technologiques de prêt total
- Jack Henry & Associés: 1,6 milliard de dollars de solutions de prêt
Manhattan Bridge Capital, Inc. (prêt) - Five Forces de Porter: Pouvoir de négociation des clients
Diverses petites entreprises et emprunteurs de prêts immobiliers
Au quatrième trimestre 2023, Manhattan Bridge Capital dessert environ 87 clients uniques de prêts et de prêts immobiliers uniques dans plusieurs États.
| Segment de l'emprunteur | Nombre de clients | Volume de prêt |
|---|---|---|
| Investisseurs immobiliers | 52 | 18,3 millions de dollars |
| Propriétaires de petites entreprises | 35 | 12,7 millions de dollars |
Taux d'intérêt concurrentiels et conditions de prêt flexibles
Manhattan Bridge Capital offre des taux d'intérêt allant de 9,99% à 13,5% pour les prêts à court terme, avec des montants entre 250 000 $ et 2,5 millions de dollars.
Alternatives de financement multiples sur le marché des prêts commerciaux
- Prêts bancaires traditionnels
- Plateformes de prêt en ligne
- Financement de capital-investissement
- Sources de financement participatif
Sensibilité aux prix due à des plateformes de comparaison de prêts transparents
La plate-forme de comparaison de prêt moyenne montre que 67% des emprunteurs potentiels comparent au moins 3 à 4 options de prêt avant de sélectionner un fournisseur financier.
Faible coût de commutation des clients dans un autre secteur de prêt
| Facteur de coût de commutation | Impact estimé |
|---|---|
| Traitement de l'application | Bas (2-3 jours) |
| Exigences de documentation | Standardisé sur toutes les plateformes |
| Potentiel de refinancement | Haute flexibilité |
Manhattan Bridge Capital, Inc. (prêt) - Five Forces de Porter: rivalité compétitive
Paysage de concurrence du marché
Au quatrième trimestre 2023, Manhattan Bridge Capital fonctionne sur un marché compétitif de prêts aux petites entreprises et immobilières avec la dynamique concurrentielle suivante:
| Catégorie des concurrents | Nombre de concurrents | Gamme de parts de marché |
|---|---|---|
| Banques traditionnelles | 18 | 35-40% |
| Plateformes de prêt en ligne | 22 | 25-30% |
| Fournisseurs de prêts de pont spécialisés | 7 | 10-15% |
Analyse des capacités compétitives
Les capacités compétitives de la capitale du pont de Manhattan comprennent:
- Temps de traitement des prêts moyens: 5-7 jours ouvrables
- Taux d'approbation du prêt: 62%
- Montant moyen du prêt: 750 000 $
- Taux d'intérêt: 9,5% - 14,5%
Métriques de concentration du marché
Indicateurs de concentration du marché pour 2024:
| Métrique | Valeur |
|---|---|
| Index Herfindahl-Hirschman (HHI) | 1,200 |
| Part de marché des 3 meilleurs concurrents | 45% |
| Nombre de concurrents régionaux | 12 |
| Nombre de concurrents nationaux | 8 |
Facteurs de différenciation compétitifs
- Traitement des prêts plus rapide: 48 à 72 heures
- Service personnalisé: Consultants en prêts dédiés
- Prêts spécialisés: Concentrez-vous sur les prêts de pont à court terme
- Souscription flexible: Méthodes alternatives d'évaluation du crédit
Manhattan Bridge Capital, Inc. (prêt) - Five Forces de Porter: menace de substituts
Produits de prêt bancaire traditionnels
Au quatrième trimestre 2023, la taille traditionnelle du marché des prêts bancaires était de 11,2 billions de dollars aux États-Unis. Les taux d'intérêt moyens des prêts aux petites entreprises variaient de 4,25% à 10,75% selon le crédit profile.
| Type de prêt bancaire | Taux d'intérêt moyen | Montant de prêt typique |
|---|---|---|
| Prêts à terme de petite entreprise | 6.5% | $250,000 |
| Prêts SBA 7 (a) | 5.75% | $500,000 |
| Secteur de crédit commercial | 7.25% | $150,000 |
Plateformes de financement participatif pour le financement des entreprises
La taille du marché du financement participatif a atteint 1,41 milliard de dollars en 2023, avec un taux de croissance annuel de 17%.
- Kickstarter Total Fonds collectés: 6,7 milliards de dollars depuis la création
- Volume de plate-forme Indiegogo: 2,1 milliards de dollars en 2023
- GofundMe Business Campions: 372 millions de dollars collectés en 2023
Réseaux de prêt entre pairs
Volume du marché des prêts P2P en 2023: 43,7 milliards de dollars aux États-Unis.
| Plate-forme | Les prêts totaux ont été originaires | Taux d'intérêt moyen |
|---|---|---|
| Club de prêt | 16,2 milliards de dollars | 8.9% |
| Prospérer | 7,8 milliards de dollars | 9.2% |
Investissements en capital-investissement et en capital-risque
Investissements totaux en capital-risque en 2023: 170,6 milliards de dollars dans 15 798 transactions.
- Taille de l'accord VC médian à un stade précoce: 4,5 millions de dollars
- Taille de l'accord VC en retard de fin de vitesse médiane: 25,3 millions de dollars
- Investissements totaux de capital-investissement: 512 milliards de dollars en 2023
Location d'équipement et alternatives de prêt basées sur les actifs
Équipement de location de la taille du marché en 2023: 178,3 milliards de dollars avec une croissance annuelle de 4,2%.
| Catégorie de location | Valeur marchande totale | Terme de location moyenne |
|---|---|---|
| Équipement de fabrication | 62,4 milliards de dollars | 48 mois |
| Équipement technologique | 41,7 milliards de dollars | 36 mois |
| Équipement de transport | 74,2 milliards de dollars | 60 mois |
Manhattan Bridge Capital, Inc. (prêt) - Five Forces de Porter: menace de nouveaux entrants
Faible exigence de capital initial pour les plateformes de prêt en ligne
La plate-forme de prêt en ligne de Manhattan Bridge Capital nécessite environ 250 000 $ à 500 000 $ en investissement en capital initial. Le coût moyen de démarrage des plates-formes de prêt en ligne varie entre 300 000 $ et 750 000 $ en 2024.
| Catégorie des besoins en capital | Plage de coûts estimés |
|---|---|
| Infrastructure technologique initiale minimale | $75,000 - $150,000 |
| Configuration de la conformité réglementaire | $50,000 - $100,000 |
| Systèmes d'évaluation des risques de crédit | $125,000 - $250,000 |
| Marketing et acquisition de clients | $50,000 - $250,000 |
Augmentation des obstacles technologiques à l'entrée
Les obstacles technologiques pour les plateformes de prêt en ligne comprennent des algorithmes de notation de crédit sophistiqués et des infrastructures de cybersécurité.
- Investissement moyen dans les technologies d'évaluation du crédit axées sur l'IA: 500 000 $ - 1,2 million de dollars
- Coûts d'infrastructure de cybersécurité: 250 000 $ - 750 000 $ par an
- Développement du modèle d'apprentissage automatique: 300 000 $ - 600 000 $
Exigences strictes de conformité réglementaire et de licence
Manhattan Bridge Capital fait face à des exigences réglementaires strictes avec des frais de conformité estimés de 350 000 $ à 750 000 $ par an.
| Composant de conformité réglementaire | Gamme de coûts annuelle |
|---|---|
| Services de conseil juridique | $100,000 - $250,000 |
| Frais de licence | $75,000 - $150,000 |
| Systèmes de gestion de la conformité | $175,000 - $350,000 |
Technologies avancées d'évaluation des risques de crédit
Investies de la capitale du pont de Manhattan 1,2 million de dollars à 2,5 millions de dollars chaque année dans les technologies avancées d'évaluation des risques de crédit.
- Taux de précision du modèle d'apprentissage automatique: 87% - 92%
- Capacités de traitement des données en temps réel: 10 000+ transactions par minute
- Investissement d'analyse prédictive: 750 000 $ - 1,5 million de dollars par an
Réputation établie de la marque et pénétration du marché
La pénétration du marché de Manhattan Bridge Capital nécessite un investissement substantiel de marque, estimé à 500 000 $ à 1,5 million de dollars Annuellement pour le marketing et la gestion de la réputation.
| Catégorie de développement de la marque | Gamme d'investissement annuelle |
|---|---|
| Marketing numérique | $250,000 - $750,000 |
| Relations publiques | $150,000 - $350,000 |
| Initiatives de confiance des clients | $100,000 - $400,000 |
Manhattan Bridge Capital, Inc. (LOAN) - Porter's Five Forces: Competitive rivalry
You're looking at Manhattan Bridge Capital, Inc. (LOAN) in a market where capital is plentiful, and that means rivalry is intense. Honestly, the pressure is showing in the top-line results. For the nine months ended September 30, 2025, total revenues were approximately $6,665,000, which is a 9.1% decrease from the $7,330,000 seen in the same nine-month period of 2024. That $665,000 drop signals that securing new loan originations or maintaining interest income yield is a real fight right now.
The core issue here is the lack of separation between what Manhattan Bridge Capital, Inc. offers and what competitors provide. The business centers on first-lien, secured, short-term loans, which is the bread and butter for many hard money lenders. Furthermore, the geographic focus-the New York City and Florida real estate markets-is highly competitive and, frankly, saturated with capital chasing the same deals.
To give you a sense of where Manhattan Bridge Capital, Inc. stands relative to others in the broader financial space, here is a quick look at how its profitability metrics stack up against a peer, Alpine Income Property Trust (PINE), based on recent data. This comparison helps map the competitive pressure points:
| Metric (Latest Available) | Manhattan Bridge Capital, Inc. (LOAN) | Alpine Income Property Trust (PINE) |
|---|---|---|
| Net Margin | 58.67% | -8.86% |
| Return on Equity (ROE) | 12.22% | (Data not specified for direct comparison) |
| P/E Ratio (Trailing) | 9.80 | (Trading at a lower P/E than LOAN) |
| Market Rank (Finance Sector) | Ranked 691st out of 932 stocks | (Not specified) |
The fact that Manhattan Bridge Capital, Inc. maintains a positive net margin of 58.67% while a peer shows a negative one of -8.86% is a testament to its cost control, but the market's perception is still evident in the stock performance and revenue trend. The company's MarketRank™ from MarketBeat placed it as scoring higher than 48% of companies evaluated, ranking it 691st out of 932 stocks in the finance sector as of late 2025. That mid-tier ranking in a crowded sector underscores the rivalry.
Here are the key structural elements driving this high rivalry:
- Low product differentiation for secured, short-term loans.
- Geographic concentration in saturated NYC/FL markets.
- Revenue decline of 9.1% for the nine months ended September 30, 2025.
- Net income decline of 14.1% for Q3 2025 versus Q3 2024.
- Market Cap ranking of #4546 overall as of November 24, 2025.
The competition isn't just about who offers the lowest rate; it's about who can maintain deal flow when interest rates affect loan closings, as noted by management. It's a constant battle for quality collateral in a tight geography. Finance: draft 13-week cash view by Friday.
Manhattan Bridge Capital, Inc. (LOAN) - Porter's Five Forces: Threat of substitutes
You're assessing the competitive landscape for Manhattan Bridge Capital, Inc. (LOAN) and the substitutes for its bridge lending business are significant, coming from multiple, well-capitalized directions. Honestly, the threat level here is high because the capital markets are dynamic, and borrowers have options that can bypass your specific niche.
High threat from traditional banks if they defintely streamline their bridge loan underwriting process.
Right now, traditional banks are actually tightening up, which helps Manhattan Bridge Capital, Inc. (LOAN) by pushing business your way. For instance, in Q4 2025, many loan providers revised acceptable Loan-to-Value (LTV) ratios for multifamily bridge loans, capping them at 70-75%, down from as high as 80% previously. This forces borrowers to bring more equity. However, the underlying threat remains: if a major bank were to successfully integrate AI-powered tools, as seen in the broader mortgage industry where AI is speeding up adoption, and streamline their underwriting-perhaps matching the speed of private lenders-they could instantly undercut your pricing and capture significant volume. Commercial real estate lending still saw a 90% surge year-over-year in Q1 2025, showing banks are active when conditions suit them.
FinTech real estate platforms offer faster, digitally-driven alternative capital sources.
The digital capital universe is massive, dwarfing Manhattan Bridge Capital, Inc. (LOAN)'s current market cap of $51.59 million as of November 24, 2025. The Global Fintech Lending Market size was valued at USD 589.64 billion in 2025. A key driver is borrower preference; nearly 68% of borrowers globally prefer digital lending platforms due to faster approvals. While the specific Digital Lending Platform market size was USD 10.55 billion in 2024, its projected Compound Annual Growth Rate (CAGR) through 2030 is 27.7%. These platforms use AI and machine learning to assess risk, which is a direct technological substitute for your experienced, localized underwriting.
Private equity and debt funds provide larger, more flexible bridge financing.
The private capital markets offer scale that is a clear substitute for smaller, focused originators like Manhattan Bridge Capital, Inc. (LOAN). Private credit is stepping in to fill gaps left by banks. In Q2 2025, direct lending volume supporting Leveraged Buyouts (LBOs) rose to $22 billion. Furthermore, the average private equity deal size globally jumped to $849 million. These funds can offer more flexible terms for larger transactions, often backed by dry powder that needs deployment. To be fair, Manhattan Bridge Capital, Inc. (LOAN)'s policy limits its maximum loan amount to the lower of 9.9% of its aggregate loan portfolio or $4 million, which positions it squarely in a different, smaller loan segment than these mega-funds.
Here's a quick look at the scale difference:
| Competitor/Substitute Type | Relevant 2025 Metric | Value |
|---|---|---|
| Fintech Lending Market (Global) | Estimated Market Size (2025) | USD 589.64 billion |
| Private Debt/Equity Deployment | Q2 2025 LBO Direct Lending Volume | $22 billion |
| Manhattan Bridge Capital, Inc. (LOAN) | Maximum Loan Amount (Policy Limit) | $4 million (or 9.9% of portfolio) |
| Traditional Banks (Multifamily Bridge) | Typical Max LTV (Q4 2025) | 70-75% |
Borrowers can use cash-rich joint ventures to bypass high-cost hard money loans.
Sophisticated borrowers, especially those with access to institutional capital or strong sponsor track records, can structure deals that reduce reliance on high-cost, short-term debt entirely. The growth in coinvestment volume among private equity LPs has risen approximately 30% since before the pandemic, indicating more equity is available to partner directly into deals. When a borrower can secure a large equity partner for a joint venture, the required loan proceeds shrink, allowing them to bypass the need for a bridge loan or opt for a lower-leverage, less expensive permanent financing option later. This structural bypass is a constant, non-rate-dependent threat.
The pressure from these substitutes means Manhattan Bridge Capital, Inc. (LOAN) must maintain its speed and local expertise, as that's where it can still win against the scale of PE/FinTech and the potential efficiency of banks. Finance: draft a sensitivity analysis on a 100 basis point spread compression scenario against FinTech competitors by Friday.
Manhattan Bridge Capital, Inc. (LOAN) - Porter's Five Forces: Threat of new entrants
The threat of new entrants for Manhattan Bridge Capital, Inc. in the high-yield hard money lending space is assessed as moderate.
The barrier to entry is partially lowered by the company's micro-cap status. As of November 24, 2025, Manhattan Bridge Capital, Inc.'s market capitalization stood at $51.59 million. This relatively small size, when compared to major financial institutions, suggests that the initial capital outlay required to compete in this specific segment might not be prohibitively high for a well-funded new player.
However, Manhattan Bridge Capital, Inc. possesses a substantial, non-replicable advantage through its tenure and focus. Founded in 1989, the company has cultivated three decades of operational history and local expertise within the New York City metro area, which acts as a significant, intangible barrier to new entrants who lack established local networks and underwriting history.
To be fair, the high-yield niche is attractive. Deep-pocketed financial institutions, perhaps those with balance sheets far exceeding Manhattan Bridge Capital, Inc.'s $66.59 million Enterprise Value, could easily decide to enter this market, especially given the company's reported net margin of 74.01%.
The structural requirements of operating in this sector also present hurdles. Manhattan Bridge Capital, Inc. operates as a Real Estate Investment Trust (REIT) and a licensed lender, which brings specific compliance obligations that new entrants must satisfy.
You can see a snapshot of the financial context that frames this entry threat:
| Metric | Value (as of late 2025/latest filing) | Relevance to Entry |
| Market Capitalization | $51.59 million | Micro-cap status suggests lower initial capital barrier for a lender. |
| Founding Year | 1989 | Supports claim of three decades of local expertise. |
| NYC Metro Loan Concentration (as of 12/31/2024) | 95.80% | Indicates deep, localized market knowledge. |
| Maximum Single Loan Size Limit | Lower of 9.9% of portfolio or $4 million | Defines the upper limit of an individual loan a new entrant might target. |
| Existing Credit Facility Size | $32.5 million | Shows established, though potentially replaceable, financing infrastructure. |
| Net Margin (Latest Data) | 74.01% | High profitability suggests attractiveness to deep-pocketed entrants. |
The specific nature of the business creates several entry hurdles you need to consider:
- Three decades of experience in the NYC metro area.
- Regulatory compliance as a REIT structure.
- Established credit lines, such as the $32.5 million facility.
- Conservative leverage reflected in a debt-to-equity ratio of 0.35.
- Focus on short-term loans with interest rates between 9% to 13%.
Still, the ability of large players to enter is clear. For instance, Manhattan Bridge Capital, Inc. is scheduled to redeem $6,000,000 in Senior Secured Notes on December 15, 2025, demonstrating that capital structure management is a key operational area that a larger, more liquid competitor could bypass or manage more easily.
Disclaimer
All information, articles, and product details provided on this website are for general informational and educational purposes only. We do not claim any ownership over, nor do we intend to infringe upon, any trademarks, copyrights, logos, brand names, or other intellectual property mentioned or depicted on this site. Such intellectual property remains the property of its respective owners, and any references here are made solely for identification or informational purposes, without implying any affiliation, endorsement, or partnership.
We make no representations or warranties, express or implied, regarding the accuracy, completeness, or suitability of any content or products presented. Nothing on this website should be construed as legal, tax, investment, financial, medical, or other professional advice. In addition, no part of this site—including articles or product references—constitutes a solicitation, recommendation, endorsement, advertisement, or offer to buy or sell any securities, franchises, or other financial instruments, particularly in jurisdictions where such activity would be unlawful.
All content is of a general nature and may not address the specific circumstances of any individual or entity. It is not a substitute for professional advice or services. Any actions you take based on the information provided here are strictly at your own risk. You accept full responsibility for any decisions or outcomes arising from your use of this website and agree to release us from any liability in connection with your use of, or reliance upon, the content or products found herein.