
|
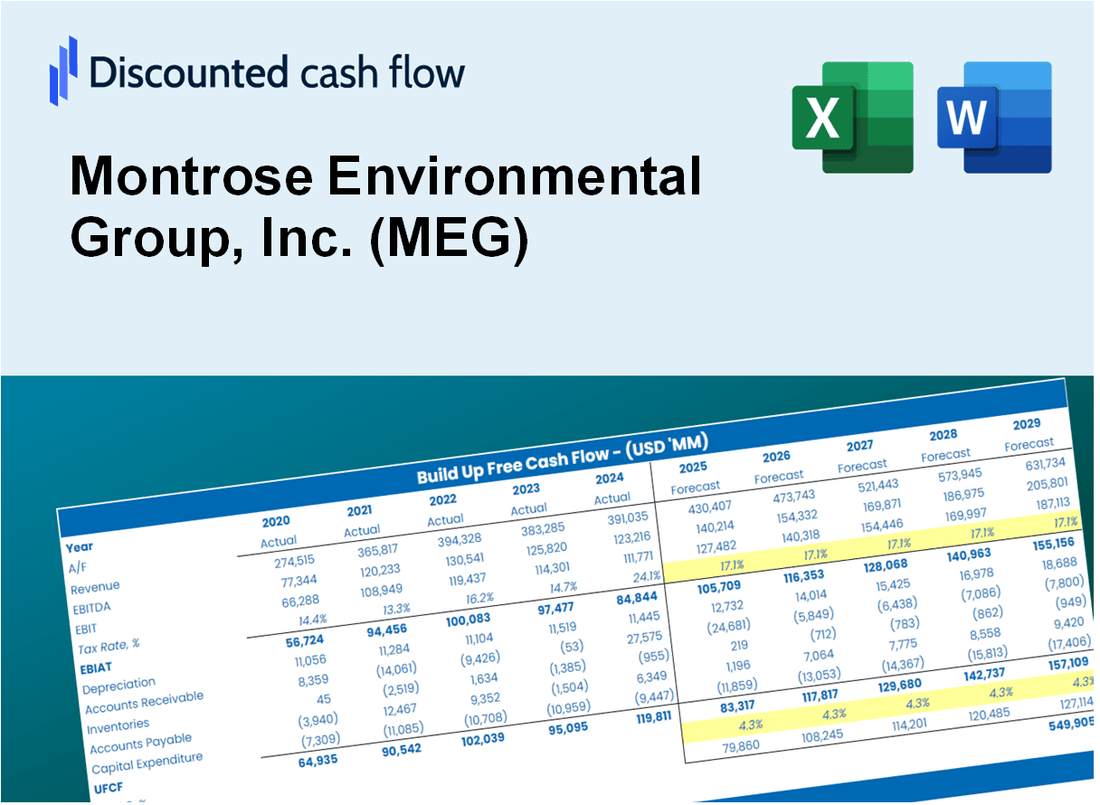
Montrose Environmental Group, Inc. (MEG) Évaluation DCF |
Entièrement Modifiable: Adapté À Vos Besoins Dans Excel Ou Sheets
Conception Professionnelle: Modèles Fiables Et Conformes Aux Normes Du Secteur
Pré-Construits Pour Une Utilisation Rapide Et Efficace
Compatible MAC/PC, entièrement débloqué
Aucune Expertise N'Est Requise; Facile À Suivre
Montrose Environmental Group, Inc. (MEG) Bundle
Améliorez vos décisions d'investissement avec la calculatrice (MEG) DCF! Utilisez des données financières réelles du groupe environnemental de Montrose, ajustez les prédictions et les dépenses de croissance et observez instantanément comment ces changements affectent la valeur intrinsèque de (MEG).
What You Will Receive
- Flexible Forecast Inputs: Modify key assumptions (growth %, margins, WACC) to develop various scenarios.
- Comprehensive Data: Montrose Environmental Group, Inc.’s (MEG) financial data pre-loaded to facilitate your analysis.
- Automated DCF Outputs: The template computes Net Present Value (NPV) and intrinsic value automatically.
- Tailored and Professional: A refined Excel model that adjusts to your valuation requirements.
- Designed for Analysts and Investors: Perfect for evaluating projections, confirming strategies, and enhancing efficiency.
Key Features
- Comprehensive Data: Montrose Environmental Group’s (MEG) historical financial reports and pre-populated forecasts.
- Customizable Inputs: Modify WACC, tax rates, revenue growth, and EBITDA margins as needed.
- Real-Time Calculations: Instantly view Montrose's intrinsic value update as you make changes.
- Intuitive Visuals: Dashboard graphs illustrate valuation results and essential metrics clearly.
- Designed for Precision: A robust tool tailored for analysts, investors, and finance professionals.
How It Works
- Download the Template: Gain immediate access to the Excel-based MEG DCF Calculator.
- Input Your Assumptions: Modify the yellow-highlighted cells for growth rates, WACC, margins, and other variables.
- Instant Calculations: The model automatically recalculates Montrose Environmental Group’s intrinsic value.
- Test Scenarios: Experiment with various assumptions to assess potential valuation fluctuations.
- Analyze and Decide: Utilize the findings to inform your investment or financial decisions.
Why Choose Montrose Environmental Group, Inc. (MEG)?
- Expertise in Environmental Solutions: Leverage our extensive experience in providing sustainable environmental services.
- Commitment to Quality: Our rigorous standards ensure reliable and effective solutions for your environmental needs.
- Innovative Approaches: We utilize cutting-edge technology and strategies to address complex environmental challenges.
- Client-Centric Focus: Our tailored services are designed to meet the unique requirements of each client.
- Proven Track Record: Trusted by a diverse range of industries for our professionalism and results-driven approach.
Who Should Use This Product?
- Investors: Accurately assess Montrose Environmental Group’s fair value before making investment choices.
- CFOs: Utilize a professional-grade DCF model for financial analysis and reporting.
- Consultants: Easily modify the template for valuation reports tailored to client needs.
- Entrepreneurs: Acquire insights into financial modeling practices employed by leading environmental firms.
- Educators: Implement it as a teaching resource to illustrate valuation techniques.
What the Template Contains
- Pre-Filled DCF Model: Montrose Environmental Group's (MEG) financial data preloaded for immediate use.
- WACC Calculator: Detailed calculations for Weighted Average Cost of Capital.
- Financial Ratios: Evaluate Montrose's profitability, leverage, and efficiency.
- Editable Inputs: Change assumptions such as growth, margins, and CAPEX to fit your scenarios.
- Financial Statements: Annual and quarterly reports to support detailed analysis.
- Interactive Dashboard: Easily visualize key valuation metrics and results.
Disclaimer
All information, articles, and product details provided on this website are for general informational and educational purposes only. We do not claim any ownership over, nor do we intend to infringe upon, any trademarks, copyrights, logos, brand names, or other intellectual property mentioned or depicted on this site. Such intellectual property remains the property of its respective owners, and any references here are made solely for identification or informational purposes, without implying any affiliation, endorsement, or partnership.
We make no representations or warranties, express or implied, regarding the accuracy, completeness, or suitability of any content or products presented. Nothing on this website should be construed as legal, tax, investment, financial, medical, or other professional advice. In addition, no part of this site—including articles or product references—constitutes a solicitation, recommendation, endorsement, advertisement, or offer to buy or sell any securities, franchises, or other financial instruments, particularly in jurisdictions where such activity would be unlawful.
All content is of a general nature and may not address the specific circumstances of any individual or entity. It is not a substitute for professional advice or services. Any actions you take based on the information provided here are strictly at your own risk. You accept full responsibility for any decisions or outcomes arising from your use of this website and agree to release us from any liability in connection with your use of, or reliance upon, the content or products found herein.