
|
M / i Homes, Inc. (MHO) Évaluation DCF |
Entièrement Modifiable: Adapté À Vos Besoins Dans Excel Ou Sheets
Conception Professionnelle: Modèles Fiables Et Conformes Aux Normes Du Secteur
Pré-Construits Pour Une Utilisation Rapide Et Efficace
Compatible MAC/PC, entièrement débloqué
Aucune Expertise N'Est Requise; Facile À Suivre
M/I Homes, Inc. (MHO) Bundle
Conçu pour la précision, notre calculatrice (MHO) DCF vous permet d'évaluer l'évaluation de M / I Homes, Inc. en utilisant des données financières réelles et offre une flexibilité complète pour modifier tous les paramètres essentiels pour des projections améliorées.
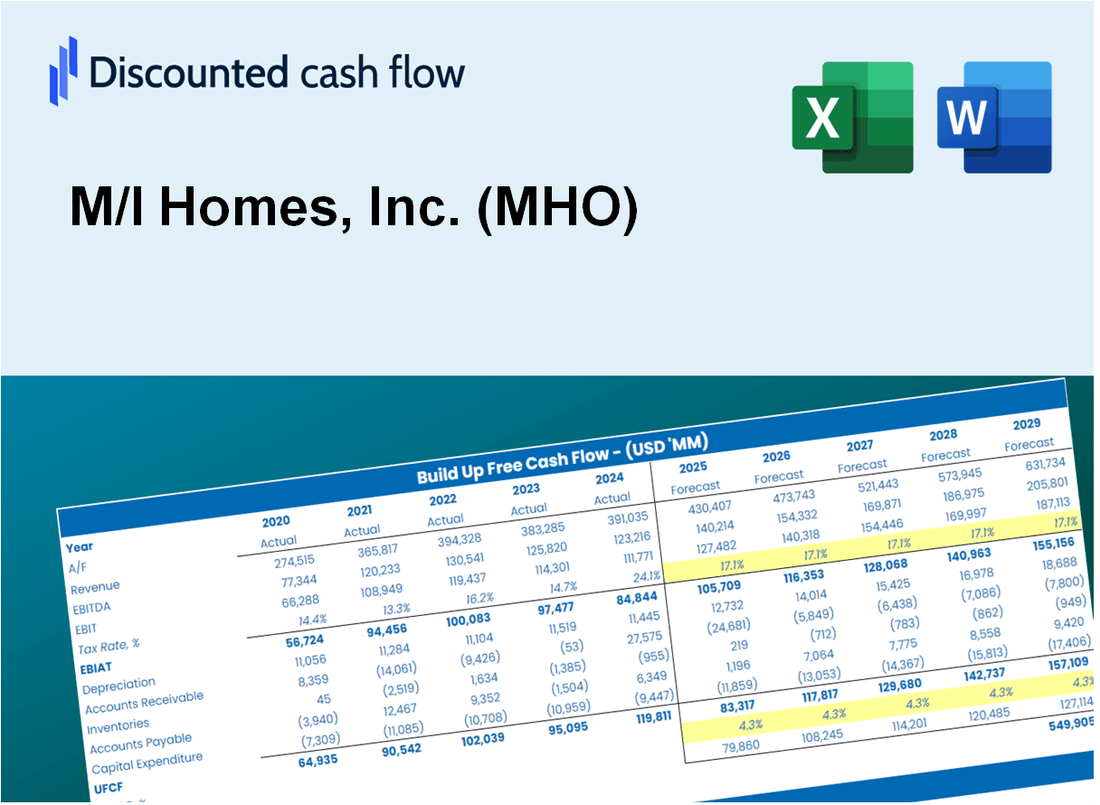
Discounted Cash Flow (DCF) - (USD MM)
| Year | AY1 2020 |
AY2 2021 |
AY3 2022 |
AY4 2023 |
AY5 2024 |
FY1 2025 |
FY2 2026 |
FY3 2027 |
FY4 2028 |
FY5 2029 |
|---|---|---|---|---|---|---|---|---|---|---|
| Revenue | 3,046.1 | 3,745.9 | 4,131.4 | 4,033.5 | 4,504.7 | 4,984.1 | 5,514.6 | 6,101.6 | 6,751.0 | 7,469.6 |
| Revenue Growth, % | 0 | 22.97 | 10.29 | -2.37 | 11.68 | 10.64 | 10.64 | 10.64 | 10.64 | 10.64 |
| EBITDA | 334.8 | 532.6 | 652.1 | 601.7 | 749.1 | 723.1 | 800.1 | 885.2 | 979.4 | 1,083.7 |
| EBITDA, % | 10.99 | 14.22 | 15.78 | 14.92 | 16.63 | 14.51 | 14.51 | 14.51 | 14.51 | 14.51 |
| Depreciation | 15.1 | 14.3 | 14.6 | 14.5 | 15.5 | 19.3 | 21.3 | 23.6 | 26.1 | 28.9 |
| Depreciation, % | 0.49449 | 0.38258 | 0.35354 | 0.35934 | 0.34302 | 0.38659 | 0.38659 | 0.38659 | 0.38659 | 0.38659 |
| EBIT | 319.7 | 518.3 | 637.5 | 587.2 | 733.6 | 703.8 | 778.7 | 861.6 | 953.3 | 1,054.8 |
| EBIT, % | 10.5 | 13.84 | 15.43 | 14.56 | 16.29 | 14.12 | 14.12 | 14.12 | 14.12 | 14.12 |
| Total Cash | 260.8 | 236.4 | 311.5 | 732.8 | 821.6 | 586.3 | 648.7 | 717.8 | 794.2 | 878.7 |
| Total Cash, percent | .0 | .0 | .0 | .0 | .0 | .0 | .0 | .0 | .0 | .0 |
| Account Receivables | -15.9 | -15.6 | -18.3 | -19.1 | .0 | -18.5 | -20.5 | -22.6 | -25.0 | -27.7 |
| Account Receivables, % | -0.52256 | -0.41622 | -0.44193 | -0.47428 | 0 | -0.371 | -0.371 | -0.371 | -0.371 | -0.371 |
| Inventories | 1,916.6 | 2,452.4 | 2,828.6 | 2,797.2 | 3,091.9 | 3,337.8 | 3,693.0 | 4,086.1 | 4,521.0 | 5,002.2 |
| Inventories, % | 62.92 | 65.47 | 68.47 | 69.35 | 68.64 | 66.97 | 66.97 | 66.97 | 66.97 | 66.97 |
| Accounts Payable | 185.7 | 244.5 | 228.6 | 204.7 | 198.6 | 275.5 | 304.8 | 337.3 | 373.2 | 412.9 |
| Accounts Payable, % | 6.1 | 6.53 | 5.53 | 5.07 | 4.41 | 5.53 | 5.53 | 5.53 | 5.53 | 5.53 |
| Capital Expenditure | -11.7 | -25.3 | -9.3 | -5.8 | -8.4 | -16.1 | -17.8 | -19.7 | -21.8 | -24.1 |
| Capital Expenditure, % | -0.38334 | -0.67543 | -0.2259 | -0.14303 | -0.18685 | -0.32291 | -0.32291 | -0.32291 | -0.32291 | -0.32291 |
| Tax Rate, % | 23.16 | 23.16 | 23.16 | 23.16 | 23.16 | 23.16 | 23.16 | 23.16 | 23.16 | 23.16 |
| EBITAT | 247.4 | 404.0 | 492.4 | 450.0 | 563.7 | 543.4 | 601.2 | 665.2 | 736.0 | 814.4 |
| Depreciation | ||||||||||
| Changes in Account Receivables | ||||||||||
| Changes in Inventories | ||||||||||
| Changes in Accounts Payable | ||||||||||
| Capital Expenditure | ||||||||||
| UFCF | -1,464.3 | -84.3 | 108.3 | 467.1 | 250.8 | 396.1 | 280.8 | 310.7 | 343.7 | 380.3 |
| WACC, % | 9.92 | 9.92 | 9.92 | 9.91 | 9.91 | 9.92 | 9.92 | 9.92 | 9.92 | 9.92 |
| PV UFCF | ||||||||||
| SUM PV UFCF | 1,299.3 | |||||||||
| Long Term Growth Rate, % | 0.50 | |||||||||
| Free cash flow (T + 1) | 382 | |||||||||
| Terminal Value | 4,059 | |||||||||
| Present Terminal Value | 2,530 | |||||||||
| Enterprise Value | 3,829 | |||||||||
| Net Debt | 215 | |||||||||
| Equity Value | 3,614 | |||||||||
| Diluted Shares Outstanding, MM | 29 | |||||||||
| Equity Value Per Share | 126.38 |
What You Will Get
- Real M/I Homes Data: Preloaded financials – from revenue to EBIT – based on actual and projected figures.
- Full Customization: Adjust all critical parameters (yellow cells) like WACC, growth %, and tax rates.
- Instant Valuation Updates: Automatic recalculations to analyze the impact of changes on M/I Homes’ fair value.
- Versatile Excel Template: Tailored for quick edits, scenario testing, and detailed projections.
- Time-Saving and Accurate: Skip building models from scratch while maintaining precision and flexibility.
Key Features
- Comprehensive M/I Homes Financials: Access precise pre-loaded historical data and future forecasts for M/I Homes, Inc. (MHO).
- Adjustable Forecast Parameters: Modify yellow-highlighted fields such as WACC, growth rates, and profit margins.
- Real-Time Calculations: Automatic updates to DCF, Net Present Value (NPV), and cash flow assessments.
- User-Friendly Dashboard: Clear charts and summaries that help visualize your valuation insights.
- Suitable for All Experience Levels: A straightforward, intuitive layout designed for investors, CFOs, and consultants alike.
How It Works
- Download the Template: Gain immediate access to the Excel-based M/I Homes, Inc. (MHO) DCF Calculator.
- Input Your Assumptions: Modify the yellow-highlighted cells for growth rates, WACC, margins, and other key metrics.
- Instant Calculations: The model will automatically refresh M/I Homes, Inc.'s (MHO) intrinsic value.
- Test Scenarios: Experiment with various assumptions to assess potential shifts in valuation.
- Analyze and Decide: Utilize the findings to inform your investment or financial strategy.
Why Choose M/I Homes, Inc. (MHO)?
- Quality Construction: We prioritize building homes with superior craftsmanship and materials.
- Customer-Centric Approach: Our team is dedicated to understanding and meeting your unique needs.
- Innovative Designs: Our homes feature modern layouts and energy-efficient solutions.
- Strong Reputation: Trusted by homeowners for over 40 years in the housing industry.
- Comprehensive Support: From financing to closing, we guide you every step of the way.
Who Should Use M/I Homes, Inc. (MHO)?
- Homebuyers: Explore a wide range of quality homes tailored to your lifestyle and budget.
- Real Estate Investors: Gain insights into market trends and opportunities for profitable investments.
- Realtors: Utilize M/I Homes' resources to assist clients in finding their dream homes.
- Construction Professionals: Collaborate with a company known for its commitment to quality and innovation in homebuilding.
- Students of Real Estate: Learn about the homebuilding industry through practical case studies and examples from M/I Homes.
What the Template Contains
- Preloaded MHO Data: Historical and projected financial data, including revenue, EBIT, and capital expenditures.
- DCF and WACC Models: Professional-grade sheets for calculating intrinsic value and Weighted Average Cost of Capital.
- Editable Inputs: Yellow-highlighted cells for adjusting revenue growth, tax rates, and discount rates.
- Financial Statements: Comprehensive annual and quarterly financials for deeper analysis.
- Key Ratios: Profitability, leverage, and efficiency ratios to evaluate performance.
- Dashboard and Charts: Visual summaries of valuation outcomes and assumptions.
Disclaimer
All information, articles, and product details provided on this website are for general informational and educational purposes only. We do not claim any ownership over, nor do we intend to infringe upon, any trademarks, copyrights, logos, brand names, or other intellectual property mentioned or depicted on this site. Such intellectual property remains the property of its respective owners, and any references here are made solely for identification or informational purposes, without implying any affiliation, endorsement, or partnership.
We make no representations or warranties, express or implied, regarding the accuracy, completeness, or suitability of any content or products presented. Nothing on this website should be construed as legal, tax, investment, financial, medical, or other professional advice. In addition, no part of this site—including articles or product references—constitutes a solicitation, recommendation, endorsement, advertisement, or offer to buy or sell any securities, franchises, or other financial instruments, particularly in jurisdictions where such activity would be unlawful.
All content is of a general nature and may not address the specific circumstances of any individual or entity. It is not a substitute for professional advice or services. Any actions you take based on the information provided here are strictly at your own risk. You accept full responsibility for any decisions or outcomes arising from your use of this website and agree to release us from any liability in connection with your use of, or reliance upon, the content or products found herein.