
|
MMTC Limited (MMTC.NS) Évaluation DCF |
Entièrement Modifiable: Adapté À Vos Besoins Dans Excel Ou Sheets
Conception Professionnelle: Modèles Fiables Et Conformes Aux Normes Du Secteur
Pré-Construits Pour Une Utilisation Rapide Et Efficace
Compatible MAC/PC, entièrement débloqué
Aucune Expertise N'Est Requise; Facile À Suivre
MMTC Limited (MMTC.NS) Bundle
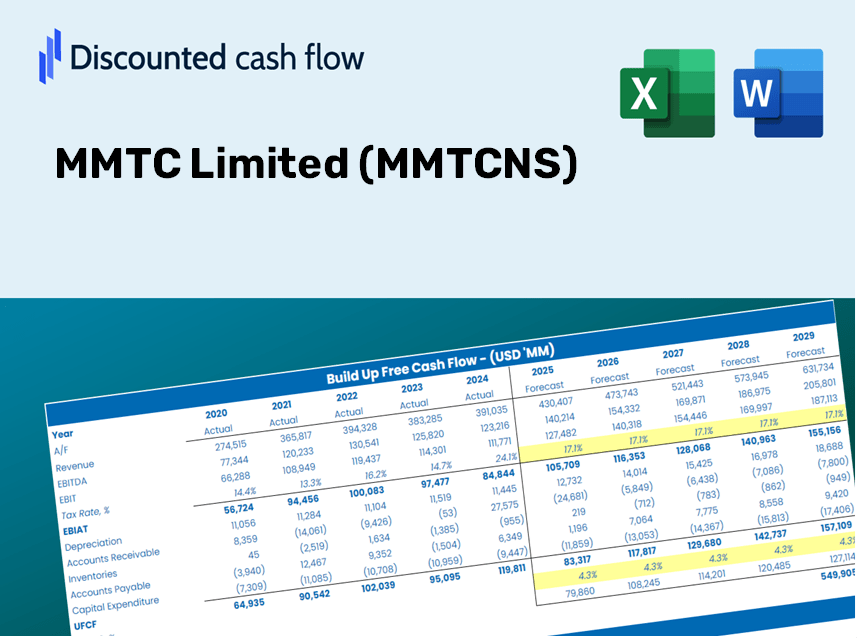
Découvrez le véritable potentiel de MMTC Limited avec notre calculatrice DCF de qualité professionnelle! Ajustez les hypothèses clés, explorez divers scénarios et évaluez comment les changements affectent l'évaluation de MMTC Limited - le tout dans un seul modèle Excel.
Discounted Cash Flow (DCF) - (USD MM)
| Year | AY1 2021 |
AY2 2022 |
AY3 2023 |
AY4 2024 |
AY5 2025 |
FY1 2026 |
FY2 2027 |
FY3 2028 |
FY4 2029 |
FY5 2030 |
|---|---|---|---|---|---|---|---|---|---|---|
| Revenue | 299,731.1 | 112,423.0 | 35,281.8 | 53.4 | 26.9 | 8.0 | 2.4 | .7 | .2 | .1 |
| Revenue Growth, % | 0 | -62.49 | -68.62 | -99.85 | -49.63 | -70.15 | -70.15 | -70.15 | -70.15 | -70.15 |
| EBITDA | -9,049.2 | 3,189.8 | 14,032.1 | 817.8 | 1,242.0 | 3.8 | 1.1 | .3 | .1 | .0 |
| EBITDA, % | -3.02 | 2.84 | 39.77 | 1531.46 | 4617.1 | 47.92 | 47.92 | 47.92 | 47.92 | 47.92 |
| Depreciation | 55.3 | 48.3 | 51.3 | 42.6 | 45.1 | 2.9 | .9 | .3 | .1 | .0 |
| Depreciation, % | 0.01844987 | 0.04296274 | 0.1454 | 79.78 | 167.66 | 36 | 36 | 36 | 36 | 36 |
| EBIT | -9,104.5 | 3,141.5 | 13,980.8 | 775.2 | 1,196.9 | 3.8 | 1.1 | .3 | .1 | .0 |
| EBIT, % | -3.04 | 2.79 | 39.63 | 1451.69 | 4449.44 | 47.88 | 47.88 | 47.88 | 47.88 | 47.88 |
| Total Cash | 1,649.9 | 1,532.3 | 12,866.6 | 12,682.3 | 14,313.8 | 3.8 | 1.1 | .3 | .1 | .0 |
| Total Cash, percent | .0 | .0 | .0 | .0 | .1 | .0 | .0 | .0 | .0 | .0 |
| Account Receivables | 8,341.1 | 6,209.0 | 4,045.6 | 4,220.5 | 1,599.4 | 3.5 | 1.1 | .3 | .1 | .0 |
| Account Receivables, % | 2.78 | 5.52 | 11.47 | 7903.56 | 5945.72 | 43.95 | 43.95 | 43.95 | 43.95 | 43.95 |
| Inventories | 456.5 | 298.0 | 11.5 | 3.6 | 3.6 | .3 | .1 | .0 | .0 | .0 |
| Inventories, % | 0.1523 | 0.26507 | 0.03259471 | 6.74 | 13.38 | 4.11 | 4.11 | 4.11 | 4.11 | 4.11 |
| Accounts Payable | 9,983.1 | 4,186.5 | 3,457.5 | 3,374.2 | 2,395.0 | 3.5 | 1.0 | .3 | .1 | .0 |
| Accounts Payable, % | 3.33 | 3.72 | 9.8 | 6318.73 | 8903.35 | 43.37 | 43.37 | 43.37 | 43.37 | 43.37 |
| Capital Expenditure | -4.2 | -13.9 | -2.5 | -3.8 | -2.3 | -.3 | -.1 | .0 | .0 | .0 |
| Capital Expenditure, % | -0.00140126 | -0.01236402 | -0.00708581 | -7.12 | -8.55 | -3.14 | -3.14 | -3.14 | -3.14 | -3.14 |
| Tax Rate, % | 24.21 | 24.21 | 24.21 | 24.21 | 24.21 | 24.21 | 24.21 | 24.21 | 24.21 | 24.21 |
| EBITAT | -6,460.2 | -8,025.3 | 12,367.2 | 744.9 | 907.2 | 2.5 | .8 | .2 | .1 | .0 |
| Depreciation | ||||||||||
| Changes in Account Receivables | ||||||||||
| Changes in Inventories | ||||||||||
| Changes in Accounts Payable | ||||||||||
| Capital Expenditure | ||||||||||
| UFCF | -5,223.6 | -11,496.9 | 14,136.9 | 533.4 | 2,591.9 | -787.2 | 1.8 | .5 | .2 | .0 |
| WACC, % | 7.56 | 7.53 | 7.57 | 7.57 | 7.56 | 7.56 | 7.56 | 7.56 | 7.56 | 7.56 |
| PV UFCF | ||||||||||
| SUM PV UFCF | -729.7 | |||||||||
| Long Term Growth Rate, % | 4.00 | |||||||||
| Free cash flow (T + 1) | 0 | |||||||||
| Terminal Value | 1 | |||||||||
| Present Terminal Value | 1 | |||||||||
| Enterprise Value | -729 | |||||||||
| Net Debt | -13,388 | |||||||||
| Equity Value | 12,660 | |||||||||
| Diluted Shares Outstanding, MM | 1,830 | |||||||||
| Equity Value Per Share | 6.92 |
What You Will Receive
- Customizable Excel Template: An Excel-based DCF Calculator tailored for MMTC Limited with pre-populated financial data.
- Accurate Data: Access to historical data and forward-looking projections (highlighted in yellow cells).
- Adjustable Forecasts: Modify key assumptions such as revenue growth, EBITDA margin, and WACC.
- Real-Time Calculations: Immediately observe how your adjustments affect the valuation of MMTC Limited.
- Professional-Grade Tool: Designed for investors, CFOs, consultants, and financial analysts.
- Intuitive Interface: Organized for easy navigation, complemented by detailed instructions for users.
Main Features
- Genuine MMTC Financial Data: Access reliable historical data and future forecasts, pre-loaded for your convenience.
- Adjustable Forecast Parameters: Modify highlighted cells for key variables like WACC, growth rates, and profit margins.
- Real-Time Calculations: Instant updates to DCF, Net Present Value (NPV), and cash flow evaluations.
- User-Friendly Dashboard: Intuitive charts and overviews to help you visualize your valuation findings.
- Designed for All Users: A straightforward and accessible layout tailored for investors, CFOs, and consultants alike.
How It Works
- Step 1: Download the prebuilt Excel template containing MMTC Limited’s (MMTCNS) data.
- Step 2: Navigate through the pre-filled sheets to familiarize yourself with the key metrics.
- Step 3: Modify forecasts and assumptions in the editable yellow cells (WACC, growth, margins).
- Step 4: Instantly access recalculated outcomes, including MMTC Limited’s (MMTCNS) intrinsic value.
- Step 5: Utilize the results to make informed investment choices or generate detailed reports.
Why Select MMTC Limited (MMTCNS) Calculator?
- Precision: Leveraging authentic MMTC financials for reliable data.
- Customizability: Built for users to easily test and adjust inputs as needed.
- Efficiency: Eliminate the complexity of creating a financial model from the ground up.
- Expert-Level: Crafted with the expertise and usability expected by financial professionals.
- Intuitive: User-friendly design, accessible to those with limited financial modeling skills.
Who Should Benefit from MMTC Limited (MMTCNS)?
- Individual Investors: Gain insights to make educated choices about investing in MMTC Limited (MMTCNS).
- Financial Analysts: Enhance valuation accuracy with comprehensive financial models tailored for MMTC Limited (MMTCNS).
- Consultants: Provide clients with timely and precise valuation analyses for MMTC Limited (MMTCNS).
- Business Owners: Discover how major corporations like MMTC Limited (MMTCNS) are valued to inform your own business strategies.
- Finance Students: Master valuation methods using practical examples based on MMTC Limited (MMTCNS) and its market data.
Contents of the Template
- Pre-Filled Data: Contains MMTC Limited's historical financials and projections.
- Discounted Cash Flow Model: An editable DCF valuation model with automatic calculations.
- Weighted Average Cost of Capital (WACC): A dedicated worksheet for calculating WACC using customized inputs.
- Key Financial Ratios: Evaluate MMTC Limited's profitability, efficiency, and financial leverage.
- Customizable Inputs: Easily modify revenue growth, margins, and tax rates.
- Clear Dashboard: Visual charts and tables summarizing essential valuation outcomes.
Disclaimer
All information, articles, and product details provided on this website are for general informational and educational purposes only. We do not claim any ownership over, nor do we intend to infringe upon, any trademarks, copyrights, logos, brand names, or other intellectual property mentioned or depicted on this site. Such intellectual property remains the property of its respective owners, and any references here are made solely for identification or informational purposes, without implying any affiliation, endorsement, or partnership.
We make no representations or warranties, express or implied, regarding the accuracy, completeness, or suitability of any content or products presented. Nothing on this website should be construed as legal, tax, investment, financial, medical, or other professional advice. In addition, no part of this site—including articles or product references—constitutes a solicitation, recommendation, endorsement, advertisement, or offer to buy or sell any securities, franchises, or other financial instruments, particularly in jurisdictions where such activity would be unlawful.
All content is of a general nature and may not address the specific circumstances of any individual or entity. It is not a substitute for professional advice or services. Any actions you take based on the information provided here are strictly at your own risk. You accept full responsibility for any decisions or outcomes arising from your use of this website and agree to release us from any liability in connection with your use of, or reliance upon, the content or products found herein.