
|
Manitex International, Inc. (MNTX) Évaluation DCF |
Entièrement Modifiable: Adapté À Vos Besoins Dans Excel Ou Sheets
Conception Professionnelle: Modèles Fiables Et Conformes Aux Normes Du Secteur
Pré-Construits Pour Une Utilisation Rapide Et Efficace
Compatible MAC/PC, entièrement débloqué
Aucune Expertise N'Est Requise; Facile À Suivre
Manitex International, Inc. (MNTX) Bundle
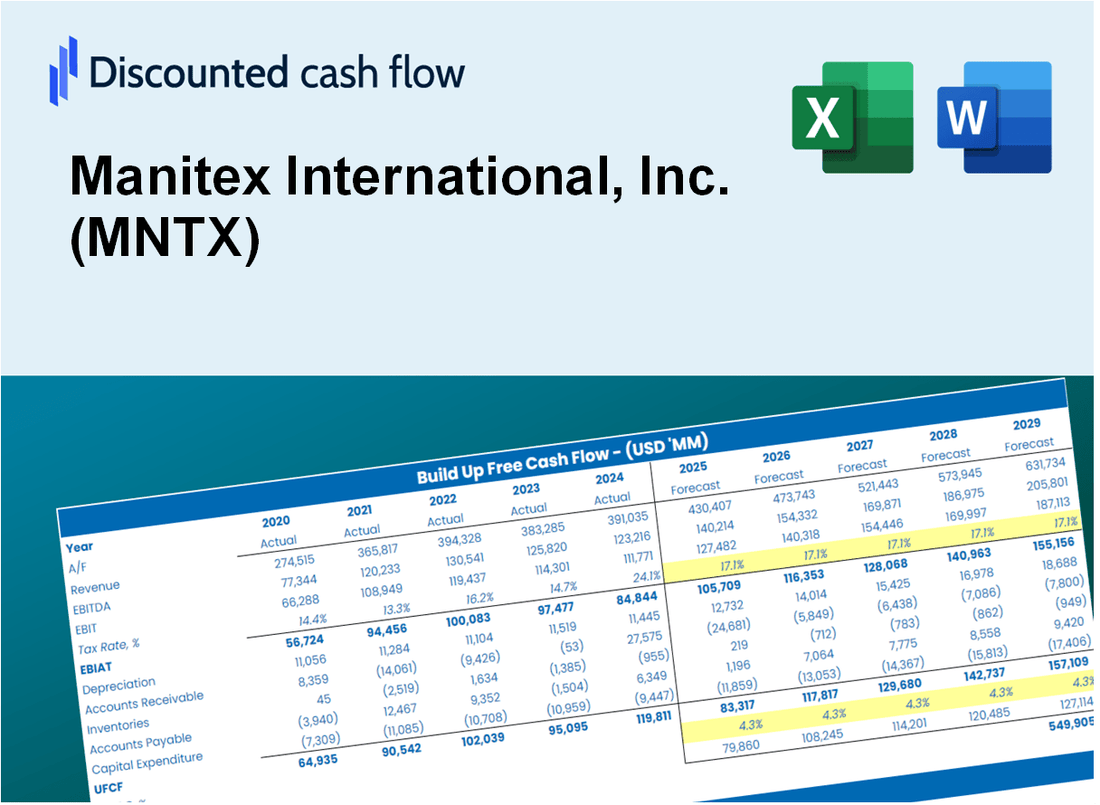
Améliorez votre stratégie d'investissement avec la calculatrice DCF de Manitex International, Inc. (MNTX)! Explorez de véritables données financières de Manitex, ajustez les prévisions et les dépenses de croissance et observez instantanément comment ces changements influencent la valeur intrinsèque de Manitex International, Inc. (MNTX).
What You Will Get
- Real MNTX Financials: Access to historical and projected data for precise valuation.
- Customizable Inputs: Adjust WACC, tax rates, revenue growth, and capital expenditures as needed.
- Dynamic Calculations: Intrinsic value and NPV are calculated in real-time.
- Scenario Analysis: Explore various scenarios to assess Manitex's future performance.
- User-Friendly Design: Designed for industry professionals while remaining approachable for newcomers.
Key Features
- Comprehensive Financial Data: Gain access to reliable pre-loaded historical data and future forecasts for Manitex International, Inc. (MNTX).
- Adjustable Forecast Parameters: Modify highlighted fields such as WACC, growth rates, and profit margins to fit your analysis.
- Real-Time Calculations: Enjoy automatic updates for DCF, Net Present Value (NPV), and cash flow assessments.
- Interactive Visual Dashboard: Utilize clear charts and summaries to effectively present your valuation findings.
- Designed for All Skill Levels: A user-friendly layout tailored for investors, CFOs, and consultants alike.
How It Works
- Step 1: Download the prebuilt Excel template featuring Manitex International, Inc.'s (MNTX) data.
- Step 2: Navigate through the pre-filled sheets to familiarize yourself with the essential metrics.
- Step 3: Adjust forecasts and assumptions in the editable yellow cells (WACC, growth, margins).
- Step 4: Instantly see the recalculated results, including Manitex International, Inc.'s (MNTX) intrinsic value.
- Step 5: Make well-informed investment decisions or create reports based on the outputs.
Why Choose This Calculator?
- User-Friendly Interface: Perfect for both novices and seasoned professionals.
- Customizable Inputs: Easily adjust parameters to suit your financial analysis.
- Real-Time Feedback: Watch the valuation of Manitex International, Inc. (MNTX) change instantly as you modify inputs.
- Preloaded Data: Comes equipped with Manitex's latest financial information for immediate analysis.
- Relied Upon by Experts: A go-to tool for investors and analysts seeking to make educated choices.
Who Should Use This Product?
- Finance Students: Explore financial modeling techniques and apply them to real-world data for Manitex International, Inc. (MNTX).
- Academics: Integrate industry-standard models into your curriculum or research focused on Manitex International, Inc. (MNTX).
- Investors: Validate your investment strategies and evaluate valuation metrics for Manitex International, Inc. (MNTX).
- Analysts: Enhance your analysis process with a customizable DCF model tailored for Manitex International, Inc. (MNTX).
- Small Business Owners: Understand the valuation approaches used for public companies like Manitex International, Inc. (MNTX).
What the Template Contains
- Pre-Filled Data: Contains Manitex International, Inc.'s historical financials and projections.
- Discounted Cash Flow Model: Editable DCF valuation model featuring automatic calculations.
- Weighted Average Cost of Capital (WACC): A dedicated sheet for determining WACC based on user-defined inputs.
- Key Financial Ratios: Evaluate Manitex's profitability, efficiency, and financial leverage.
- Customizable Inputs: Easily modify revenue growth, profit margins, and tax rates.
- Clear Dashboard: Visual summaries through charts and tables highlighting key valuation outcomes.
Disclaimer
All information, articles, and product details provided on this website are for general informational and educational purposes only. We do not claim any ownership over, nor do we intend to infringe upon, any trademarks, copyrights, logos, brand names, or other intellectual property mentioned or depicted on this site. Such intellectual property remains the property of its respective owners, and any references here are made solely for identification or informational purposes, without implying any affiliation, endorsement, or partnership.
We make no representations or warranties, express or implied, regarding the accuracy, completeness, or suitability of any content or products presented. Nothing on this website should be construed as legal, tax, investment, financial, medical, or other professional advice. In addition, no part of this site—including articles or product references—constitutes a solicitation, recommendation, endorsement, advertisement, or offer to buy or sell any securities, franchises, or other financial instruments, particularly in jurisdictions where such activity would be unlawful.
All content is of a general nature and may not address the specific circumstances of any individual or entity. It is not a substitute for professional advice or services. Any actions you take based on the information provided here are strictly at your own risk. You accept full responsibility for any decisions or outcomes arising from your use of this website and agree to release us from any liability in connection with your use of, or reliance upon, the content or products found herein.