
|
Marqeta, Inc. (MQ) Évaluation DCF |
Entièrement Modifiable: Adapté À Vos Besoins Dans Excel Ou Sheets
Conception Professionnelle: Modèles Fiables Et Conformes Aux Normes Du Secteur
Pré-Construits Pour Une Utilisation Rapide Et Efficace
Compatible MAC/PC, entièrement débloqué
Aucune Expertise N'Est Requise; Facile À Suivre
Marqeta, Inc. (MQ) Bundle
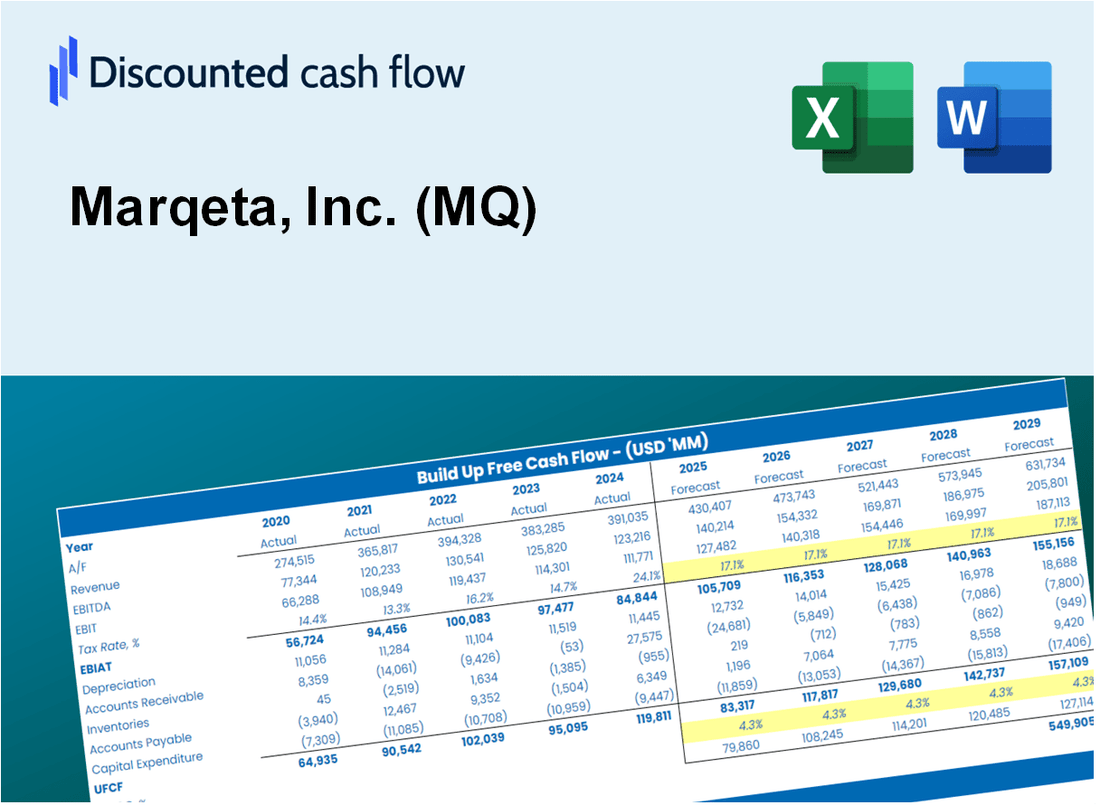
Que vous soyez un investisseur ou un analyste, cette calculatrice DCF (MQ) est votre ressource incontournable pour une évaluation précise. Préchargé avec des données réelles de Marqeta, Inc., vous pouvez ajuster les prévisions et observer les effets en temps réel.
What You Will Get
- Real MQ Financials: Access to historical and projected data for precise valuation.
- Customizable Inputs: Adjust WACC, tax rates, revenue growth, and capital expenditures as needed.
- Dynamic Calculations: Intrinsic value and NPV are computed automatically.
- Scenario Analysis: Explore various scenarios to assess Marqeta’s future performance.
- User-Friendly Design: Designed for professionals while remaining approachable for newcomers.
Key Features
- 🔍 Real-Life MQ Financials: Pre-filled historical and projected data for Marqeta, Inc.
- ✏️ Fully Customizable Inputs: Adjust all critical parameters (yellow cells) like WACC, growth %, and tax rates.
- 📊 Professional DCF Valuation: Built-in formulas calculate Marqeta’s intrinsic value using the Discounted Cash Flow method.
- ⚡ Instant Results: Visualize Marqeta’s valuation instantly after making changes.
- Scenario Analysis: Test and compare outcomes for various financial assumptions side-by-side.
How It Works
- 1. Access the Template: Download and open the Excel file featuring Marqeta’s preloaded data.
- 2. Modify Assumptions: Adjust key inputs such as growth rates, WACC, and capital expenditures.
- 3. View Results in Real-Time: The DCF model automatically calculates intrinsic value and NPV.
- 4. Explore Scenarios: Analyze various forecasts to evaluate different valuation outcomes.
- 5. Present with Assurance: Share professional valuation insights to enhance your decision-making process.
Why Choose This Calculator for Marqeta, Inc. (MQ)?
- All-in-One Solution: Features DCF, WACC, and financial ratio analyses tailored for Marqeta, Inc. (MQ).
- Flexible Inputs: Modify the yellow-highlighted cells to explore different financial scenarios.
- In-Depth Analysis: Automatically computes Marqeta, Inc.'s (MQ) intrinsic value and Net Present Value.
- Preloaded Information: Historical and projected data provide reliable starting points for analysis.
- High-Quality Standards: Perfect for financial analysts, investors, and business consultants focusing on Marqeta, Inc. (MQ).
Who Should Use This Product?
- Fintech Students: Understand payment processing and apply concepts using real-world data.
- Researchers: Integrate advanced payment models into academic studies or projects.
- Investors: Evaluate your investment strategies and analyze valuation scenarios for Marqeta, Inc. (MQ).
- Financial Analysts: Enhance your analysis with a customizable model tailored for payment solutions.
- Startup Founders: Learn from the operational frameworks of successful payment companies like Marqeta.
What the Template Contains
- Pre-Filled Data: Includes Marqeta, Inc.'s (MQ) historical financials and forecasts.
- Discounted Cash Flow Model: Editable DCF valuation model with automatic calculations.
- Weighted Average Cost of Capital (WACC): A dedicated sheet for calculating WACC based on custom inputs.
- Key Financial Ratios: Analyze Marqeta, Inc.'s (MQ) profitability, efficiency, and leverage.
- Customizable Inputs: Edit revenue growth, margins, and tax rates with ease.
- Clear Dashboard: Charts and tables summarizing key valuation results.
Disclaimer
All information, articles, and product details provided on this website are for general informational and educational purposes only. We do not claim any ownership over, nor do we intend to infringe upon, any trademarks, copyrights, logos, brand names, or other intellectual property mentioned or depicted on this site. Such intellectual property remains the property of its respective owners, and any references here are made solely for identification or informational purposes, without implying any affiliation, endorsement, or partnership.
We make no representations or warranties, express or implied, regarding the accuracy, completeness, or suitability of any content or products presented. Nothing on this website should be construed as legal, tax, investment, financial, medical, or other professional advice. In addition, no part of this site—including articles or product references—constitutes a solicitation, recommendation, endorsement, advertisement, or offer to buy or sell any securities, franchises, or other financial instruments, particularly in jurisdictions where such activity would be unlawful.
All content is of a general nature and may not address the specific circumstances of any individual or entity. It is not a substitute for professional advice or services. Any actions you take based on the information provided here are strictly at your own risk. You accept full responsibility for any decisions or outcomes arising from your use of this website and agree to release us from any liability in connection with your use of, or reliance upon, the content or products found herein.