
|
NBT Bancorp Inc. (NBTB) Évaluation DCF |
Entièrement Modifiable: Adapté À Vos Besoins Dans Excel Ou Sheets
Conception Professionnelle: Modèles Fiables Et Conformes Aux Normes Du Secteur
Pré-Construits Pour Une Utilisation Rapide Et Efficace
Compatible MAC/PC, entièrement débloqué
Aucune Expertise N'Est Requise; Facile À Suivre
NBT Bancorp Inc. (NBTB) Bundle
Simplifiez la valorisation NBT Bancorp Inc. (NBTB) avec cette calculatrice DCF personnalisable! Doté de Real NBT Bancorp Inc. (NBTB) Financials and Rajustement des entrées de prévision, vous pouvez tester les scénarios et découvrir la juste valeur NBT Bancorp Inc. (NBTB) en minutes.
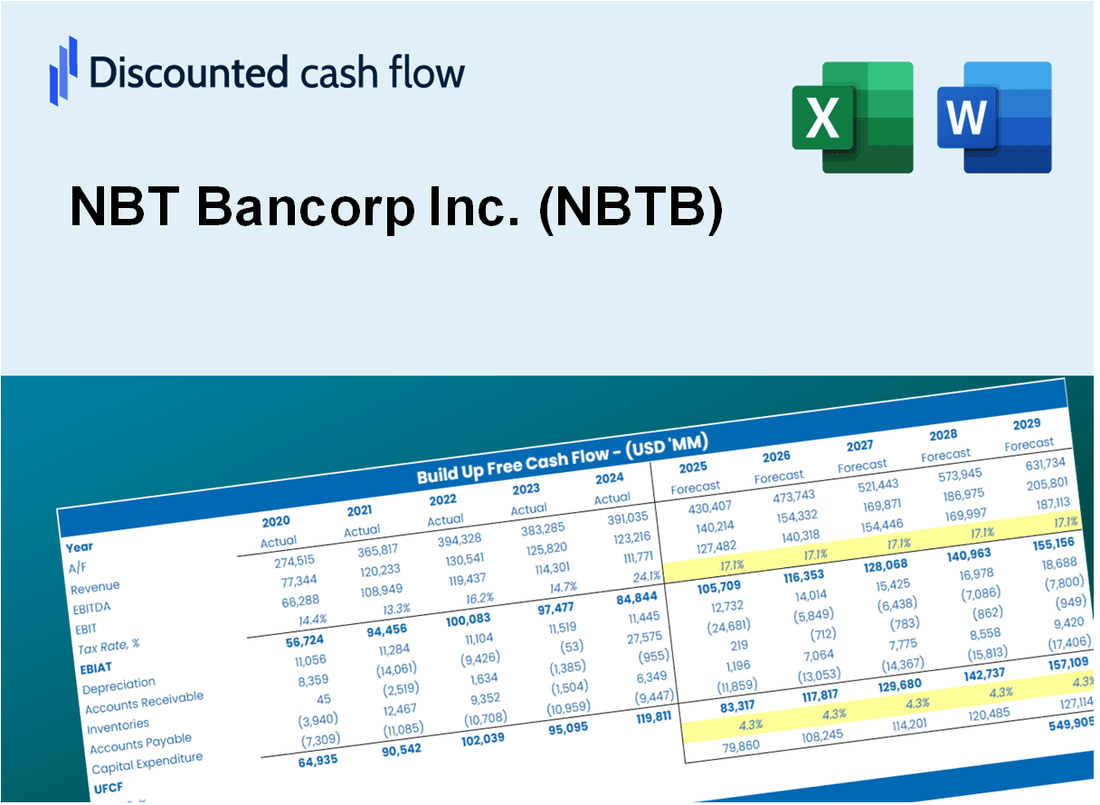
Discounted Cash Flow (DCF) - (USD MM)
| Year | AY1 2020 |
AY2 2021 |
AY3 2022 |
AY4 2023 |
AY5 2024 |
FY1 2025 |
FY2 2026 |
FY3 2027 |
FY4 2028 |
FY5 2029 |
|---|---|---|---|---|---|---|---|---|---|---|
| Revenue | 491.3 | 494.8 | 537.0 | 662.3 | 786.0 | 886.7 | 1,000.3 | 1,128.5 | 1,273.1 | 1,436.3 |
| Revenue Growth, % | 0 | 0.71082 | 8.54 | 23.34 | 18.67 | 12.81 | 12.81 | 12.81 | 12.81 | 12.81 |
| EBITDA | 153.6 | 219.7 | 215.2 | 175.7 | 207.0 | 299.0 | 337.4 | 380.6 | 429.4 | 484.4 |
| EBITDA, % | 31.27 | 44.41 | 40.08 | 26.53 | 26.33 | 33.73 | 33.73 | 33.73 | 33.73 | 33.73 |
| Depreciation | 20.5 | 19.9 | 19.1 | 22.3 | 27.5 | 33.0 | 37.2 | 42.0 | 47.4 | 53.5 |
| Depreciation, % | 4.18 | 4.02 | 3.55 | 3.36 | 3.5 | 3.72 | 3.72 | 3.72 | 3.72 | 3.72 |
| EBIT | 133.1 | 199.9 | 196.2 | 153.5 | 179.5 | 266.0 | 300.1 | 338.6 | 382.0 | 430.9 |
| EBIT, % | 27.09 | 40.4 | 36.53 | 23.17 | 22.83 | 30 | 30 | 30 | 30 | 30 |
| Total Cash | 2,021.4 | 2,956.4 | 1,724.6 | 1,636.0 | 420.4 | 804.2 | 907.3 | 1,023.6 | 1,154.7 | 1,302.7 |
| Total Cash, percent | .0 | .0 | .0 | .0 | .0 | .0 | .0 | .0 | .0 | .0 |
| Account Receivables | .0 | .0 | .0 | .0 | .0 | .0 | .0 | .0 | .0 | .0 |
| Account Receivables, % | 0 | 0 | 0 | 0 | 0 | 0 | 0 | 0 | 0 | 0 |
| Inventories | .0 | .0 | .0 | .0 | .0 | .0 | .0 | .0 | .0 | .0 |
| Inventories, % | 0 | 0 | 0 | 0 | 0 | 0 | 0 | 0 | 0 | 0 |
| Accounts Payable | .0 | .0 | .0 | .0 | .0 | .0 | .0 | .0 | .0 | .0 |
| Accounts Payable, % | 0 | 0 | 0 | 0 | 0 | 0 | 0 | 0 | 0 | 0 |
| Capital Expenditure | -8.2 | -7.7 | -7.0 | -9.3 | -11.7 | -13.2 | -14.8 | -16.7 | -18.9 | -21.3 |
| Capital Expenditure, % | -1.66 | -1.56 | -1.31 | -1.4 | -1.49 | -1.48 | -1.48 | -1.48 | -1.48 | -1.48 |
| Tax Rate, % | 21.63 | 21.63 | 21.63 | 21.63 | 21.63 | 21.63 | 21.63 | 21.63 | 21.63 | 21.63 |
| EBITAT | 104.4 | 154.9 | 152.0 | 118.8 | 140.6 | 207.1 | 233.6 | 263.6 | 297.3 | 335.4 |
| Depreciation | ||||||||||
| Changes in Account Receivables | ||||||||||
| Changes in Inventories | ||||||||||
| Changes in Accounts Payable | ||||||||||
| Capital Expenditure | ||||||||||
| UFCF | 116.8 | 167.0 | 164.0 | 131.8 | 156.4 | 226.9 | 256.0 | 288.8 | 325.8 | 367.6 |
| WACC, % | 12.13 | 12.05 | 12.04 | 12.04 | 12.12 | 12.08 | 12.08 | 12.08 | 12.08 | 12.08 |
| PV UFCF | ||||||||||
| SUM PV UFCF | 1,025.8 | |||||||||
| Long Term Growth Rate, % | 2.00 | |||||||||
| Free cash flow (T + 1) | 375 | |||||||||
| Terminal Value | 3,721 | |||||||||
| Present Terminal Value | 2,104 | |||||||||
| Enterprise Value | 3,130 | |||||||||
| Net Debt | 131 | |||||||||
| Equity Value | 2,999 | |||||||||
| Diluted Shares Outstanding, MM | 47 | |||||||||
| Equity Value Per Share | 63.23 |
What You Will Get
- Real NBT Bancorp Data: Preloaded financials – from revenue to EBIT – based on actual and projected figures.
- Full Customization: Adjust all critical parameters (yellow cells) like WACC, growth %, and tax rates.
- Instant Valuation Updates: Automatic recalculations to analyze the impact of changes on NBT Bancorp’s fair value.
- Versatile Excel Template: Tailored for quick edits, scenario testing, and detailed projections.
- Time-Saving and Accurate: Skip building models from scratch while maintaining precision and flexibility.
Key Features
- Customizable Financial Inputs: Adjust essential parameters such as loan growth, interest margins, and operational expenses.
- Instant DCF Valuation: Quickly computes intrinsic value, net present value (NPV), and other financial metrics.
- High-Precision Estimates: Leverages NBT Bancorp Inc.'s (NBTB) actual financial data for accurate valuation results.
- Effortless Scenario Testing: Easily explore various assumptions and evaluate their impacts on outcomes.
- Efficiency Booster: Save time by avoiding the creation of intricate valuation models from the ground up.
How It Works
- Download: Obtain the pre-configured Excel file containing NBT Bancorp Inc.'s (NBTB) financial data.
- Customize: Modify projections, such as revenue growth, EBITDA %, and WACC.
- Update Automatically: The intrinsic value and NPV calculations refresh in real-time.
- Test Scenarios: Develop various forecasts and instantly compare the results.
- Make Decisions: Leverage the valuation outcomes to inform your investment approach.
Why Choose This Calculator for NBT Bancorp Inc. (NBTB)?
- All-in-One Solution: Features DCF, WACC, and key financial ratio analyses in a single platform.
- Flexible Inputs: Modify the highlighted cells to explore different financial scenarios.
- In-Depth Analysis: Automatically computes NBT Bancorp’s intrinsic value and Net Present Value.
- Preloaded Information: Historical and projected data provide reliable starting points for analysis.
- High-Quality Standards: Perfect for financial analysts, investors, and business consultants focusing on NBT Bancorp Inc. (NBTB).
Who Should Use This Product?
- Investors: Evaluate NBT Bancorp Inc.'s (NBTB) performance before making investment decisions.
- CFOs and Financial Analysts: Optimize valuation methods and assess financial forecasts for NBT Bancorp Inc. (NBTB).
- Startup Founders: Understand the valuation strategies of established financial institutions like NBT Bancorp Inc. (NBTB).
- Consultants: Create comprehensive valuation reports for clients involving NBT Bancorp Inc. (NBTB).
- Students and Educators: Utilize real-time data from NBT Bancorp Inc. (NBTB) to learn and teach valuation methodologies.
What the Template Contains
- Historical Data: Includes NBT Bancorp Inc.'s (NBTB) past financials and baseline forecasts.
- DCF and Levered DCF Models: Detailed templates to calculate NBT Bancorp Inc.'s (NBTB) intrinsic value.
- WACC Sheet: Pre-built calculations for Weighted Average Cost of Capital.
- Editable Inputs: Modify key drivers like growth rates, EBITDA %, and CAPEX assumptions.
- Quarterly and Annual Statements: A complete breakdown of NBT Bancorp Inc.'s (NBTB) financials.
- Interactive Dashboard: Visualize valuation results and projections dynamically.
Disclaimer
All information, articles, and product details provided on this website are for general informational and educational purposes only. We do not claim any ownership over, nor do we intend to infringe upon, any trademarks, copyrights, logos, brand names, or other intellectual property mentioned or depicted on this site. Such intellectual property remains the property of its respective owners, and any references here are made solely for identification or informational purposes, without implying any affiliation, endorsement, or partnership.
We make no representations or warranties, express or implied, regarding the accuracy, completeness, or suitability of any content or products presented. Nothing on this website should be construed as legal, tax, investment, financial, medical, or other professional advice. In addition, no part of this site—including articles or product references—constitutes a solicitation, recommendation, endorsement, advertisement, or offer to buy or sell any securities, franchises, or other financial instruments, particularly in jurisdictions where such activity would be unlawful.
All content is of a general nature and may not address the specific circumstances of any individual or entity. It is not a substitute for professional advice or services. Any actions you take based on the information provided here are strictly at your own risk. You accept full responsibility for any decisions or outcomes arising from your use of this website and agree to release us from any liability in connection with your use of, or reliance upon, the content or products found herein.