
|
NextDecade Corporation (Next) Valation DCF |
Entièrement Modifiable: Adapté À Vos Besoins Dans Excel Ou Sheets
Conception Professionnelle: Modèles Fiables Et Conformes Aux Normes Du Secteur
Pré-Construits Pour Une Utilisation Rapide Et Efficace
Compatible MAC/PC, entièrement débloqué
Aucune Expertise N'Est Requise; Facile À Suivre
NextDecade Corporation (NEXT) Bundle
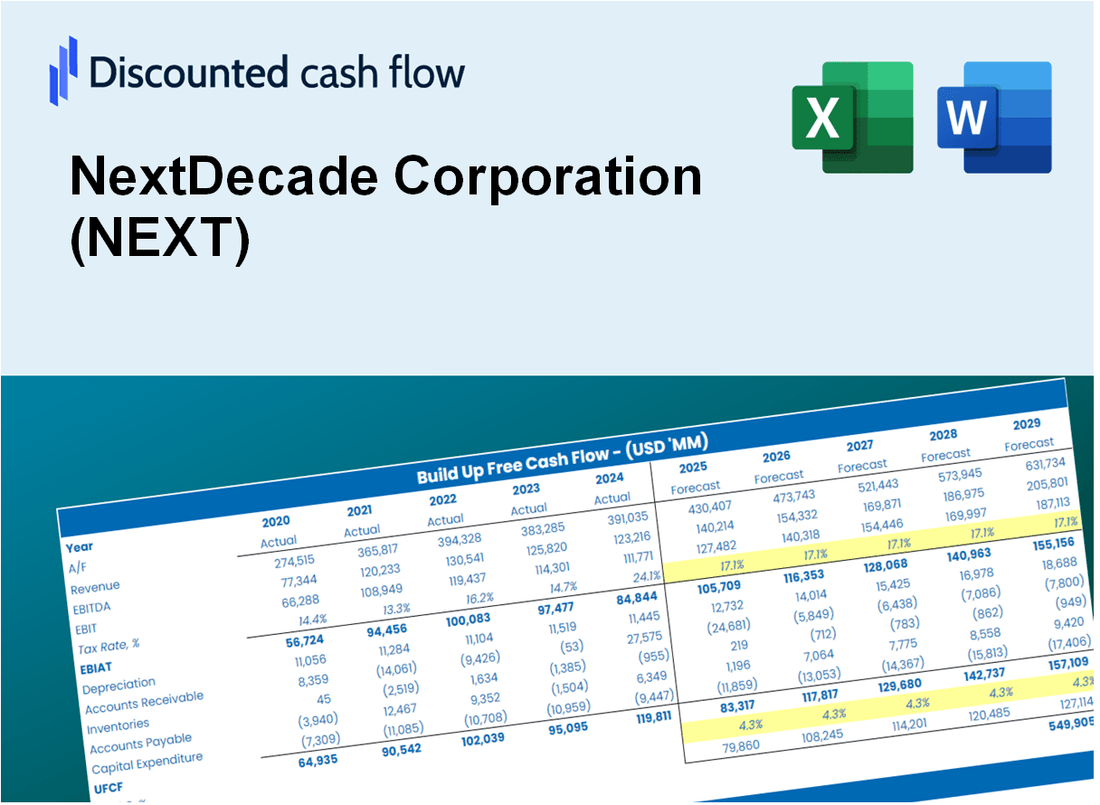
Gardez un aperçu de votre analyse d'évaluation de NextDecade Corporation (Suivant) à l'aide de notre calculatrice DCF à la pointe de la technologie! Ce modèle Excel est préchargé avec des données suivantes réelles, vous permettant d'ajuster les prévisions et les hypothèses pour un calcul précis de la valeur intrinsèque de NextDecade.
Discounted Cash Flow (DCF) - (USD MM)
| Year | AY1 2020 |
AY2 2021 |
AY3 2022 |
AY4 2023 |
AY5 2024 |
FY1 2025 |
FY2 2026 |
FY3 2027 |
FY4 2028 |
FY5 2029 |
|---|---|---|---|---|---|---|---|---|---|---|
| Revenue | .0 | .0 | .0 | .0 | .0 | .0 | .0 | .0 | .0 | .0 |
| Revenue Growth, % | 0 | 0 | 0 | 0 | 0 | 0 | 0 | 0 | 0 | 0 |
| EBITDA | -20.6 | -19.9 | -47.8 | -122.5 | 371.7 | .0 | .0 | .0 | .0 | .0 |
| EBITDA, % | 100 | 100 | 100 | 100 | 100 | 100 | 100 | 100 | 100 | 100 |
| Depreciation | 1.4 | 2.2 | 1.3 | .2 | 6.7 | .0 | .0 | .0 | .0 | .0 |
| Depreciation, % | 100 | 100 | 100 | 100 | 100 | 100 | 100 | 100 | 100 | 100 |
| EBIT | -22.0 | -22.0 | -49.1 | -122.7 | 365.0 | .0 | .0 | .0 | .0 | .0 |
| EBIT, % | 100 | 100 | 100 | 100 | 100 | 100 | 100 | 100 | 100 | 100 |
| Total Cash | 22.6 | 25.6 | 62.8 | 38.2 | 148.1 | .0 | .0 | .0 | .0 | .0 |
| Total Cash, percent | .0 | .0 | .0 | .0 | .0 | .0 | .0 | .0 | .0 | .0 |
| Account Receivables | .0 | .0 | .0 | .0 | .0 | .0 | .0 | .0 | .0 | .0 |
| Account Receivables, % | 100 | 100 | 100 | 100 | 100 | 100 | 100 | 100 | 100 | 100 |
| Inventories | .0 | .0 | .0 | .0 | .0 | .0 | .0 | .0 | .0 | .0 |
| Inventories, % | 100 | 100 | 100 | 100 | 100 | 100 | 100 | 100 | 100 | 100 |
| Accounts Payable | .2 | .3 | 1.1 | 243.1 | 244.6 | .0 | .0 | .0 | .0 | .0 |
| Accounts Payable, % | 100 | 100 | 100 | 100 | 100 | 100 | 100 | 100 | 100 | 100 |
| Capital Expenditure | -32.4 | -12.1 | -33.8 | -1,737.6 | -2,567.8 | .0 | .0 | .0 | .0 | .0 |
| Capital Expenditure, % | 100 | 100 | 100 | 100 | 100 | 0 | 0 | 0 | 0 | 0 |
| Tax Rate, % | 122.26 | 122.26 | 122.26 | 122.26 | 122.26 | 122.26 | 122.26 | 122.26 | 122.26 | 122.26 |
| EBITAT | -22.0 | -22.0 | -49.1 | -89.8 | -81.2 | .0 | .0 | .0 | .0 | .0 |
| Depreciation | ||||||||||
| Changes in Account Receivables | ||||||||||
| Changes in Inventories | ||||||||||
| Changes in Accounts Payable | ||||||||||
| Capital Expenditure | ||||||||||
| UFCF | -52.7 | -31.9 | -80.8 | -1,585.2 | -2,640.8 | -244.6 | .0 | .0 | .0 | .0 |
| WACC, % | 6.24 | 6.24 | 6.24 | 5.51 | 3.54 | 5.55 | 5.55 | 5.55 | 5.55 | 5.55 |
| PV UFCF | ||||||||||
| SUM PV UFCF | -231.8 | |||||||||
| Long Term Growth Rate, % | 2.00 | |||||||||
| Free cash flow (T + 1) | 0 | |||||||||
| Terminal Value | 0 | |||||||||
| Present Terminal Value | 0 | |||||||||
| Enterprise Value | -232 | |||||||||
| Net Debt | 3,919 | |||||||||
| Equity Value | -4,151 | |||||||||
| Diluted Shares Outstanding, MM | 259 | |||||||||
| Equity Value Per Share | -16.06 |
What You Will Get
- Real NEXT Financial Data: Pre-filled with NextDecade's historical and projected data for precise analysis.
- Fully Editable Template: Modify key inputs like revenue growth, WACC, and EBITDA % with ease.
- Automatic Calculations: See NextDecade's intrinsic value update instantly based on your changes.
- Professional Valuation Tool: Designed for investors, analysts, and consultants seeking accurate DCF results.
- User-Friendly Design: Simple structure and clear instructions for all experience levels.
Key Features
- Accurate Financial Data: Gain access to reliable pre-loaded historical figures and future forecasts for NextDecade Corporation (NEXT).
- Adjustable Forecast Parameters: Modify the yellow-highlighted cells such as WACC, growth rates, and profit margins to suit your analysis.
- Real-Time Calculations: Experience automatic updates to DCF, Net Present Value (NPV), and cash flow evaluations.
- User-Friendly Dashboard: View easy-to-interpret charts and summaries to clearly understand your valuation outcomes.
- Designed for All Users: A straightforward, intuitive layout tailored for investors, CFOs, and consultants alike.
How It Works
- Download the Template: Gain immediate access to the Excel-based NEXT DCF Calculator.
- Input Your Assumptions: Modify yellow-highlighted cells for growth rates, WACC, margins, and more.
- Instant Calculations: The model automatically refreshes NextDecade's intrinsic value.
- Test Scenarios: Experiment with various assumptions to assess potential valuation shifts.
- Analyze and Decide: Utilize the findings to inform your investment or financial analysis.
Why Choose This Calculator for NextDecade Corporation (NEXT)?
- Designed for Experts: A sophisticated tool utilized by industry analysts, CFOs, and financial consultants.
- Accurate Data: NextDecade's historical and projected financials are preloaded for precise analysis.
- Flexible Scenario Analysis: Effortlessly simulate various forecasts and assumptions.
- Comprehensive Outputs: Automatically computes intrinsic value, NPV, and essential financial metrics.
- User-Friendly: Detailed step-by-step instructions help you navigate the process smoothly.
Who Should Use This Product?
- Individual Investors: Make informed decisions about buying or selling NextDecade Corporation (NEXT) stock.
- Financial Analysts: Streamline valuation processes with ready-to-use financial models for NextDecade Corporation (NEXT).
- Consultants: Deliver professional valuation insights for NextDecade Corporation (NEXT) to clients quickly and accurately.
- Business Owners: Understand how companies like NextDecade Corporation (NEXT) are valued to guide your own strategy.
- Finance Students: Learn valuation techniques using real-world data and scenarios from NextDecade Corporation (NEXT).
What the Template Contains
- Pre-Filled DCF Model: NextDecade Corporation’s (NEXT) financial data preloaded for immediate use.
- WACC Calculator: Detailed calculations for Weighted Average Cost of Capital.
- Financial Ratios: Evaluate NextDecade Corporation’s (NEXT) profitability, leverage, and efficiency.
- Editable Inputs: Change assumptions such as growth, margins, and CAPEX to fit your scenarios.
- Financial Statements: Annual and quarterly reports to support detailed analysis.
- Interactive Dashboard: Easily visualize key valuation metrics and results.
Disclaimer
All information, articles, and product details provided on this website are for general informational and educational purposes only. We do not claim any ownership over, nor do we intend to infringe upon, any trademarks, copyrights, logos, brand names, or other intellectual property mentioned or depicted on this site. Such intellectual property remains the property of its respective owners, and any references here are made solely for identification or informational purposes, without implying any affiliation, endorsement, or partnership.
We make no representations or warranties, express or implied, regarding the accuracy, completeness, or suitability of any content or products presented. Nothing on this website should be construed as legal, tax, investment, financial, medical, or other professional advice. In addition, no part of this site—including articles or product references—constitutes a solicitation, recommendation, endorsement, advertisement, or offer to buy or sell any securities, franchises, or other financial instruments, particularly in jurisdictions where such activity would be unlawful.
All content is of a general nature and may not address the specific circumstances of any individual or entity. It is not a substitute for professional advice or services. Any actions you take based on the information provided here are strictly at your own risk. You accept full responsibility for any decisions or outcomes arising from your use of this website and agree to release us from any liability in connection with your use of, or reliance upon, the content or products found herein.