
|
Neurometrix, Inc. (Nuro) Valation DCF |
Entièrement Modifiable: Adapté À Vos Besoins Dans Excel Ou Sheets
Conception Professionnelle: Modèles Fiables Et Conformes Aux Normes Du Secteur
Pré-Construits Pour Une Utilisation Rapide Et Efficace
Compatible MAC/PC, entièrement débloqué
Aucune Expertise N'Est Requise; Facile À Suivre
NeuroMetrix, Inc. (NURO) Bundle
Rationalisez votre analyse et améliorez la précision avec notre calculatrice (Nuro) DCF! En utilisant de vraies données de neurométrix et des hypothèses personnalisables, cet outil vous permet de prévoir, analyser et valoriser Neurometrix, Inc. comme un investisseur chevronné.
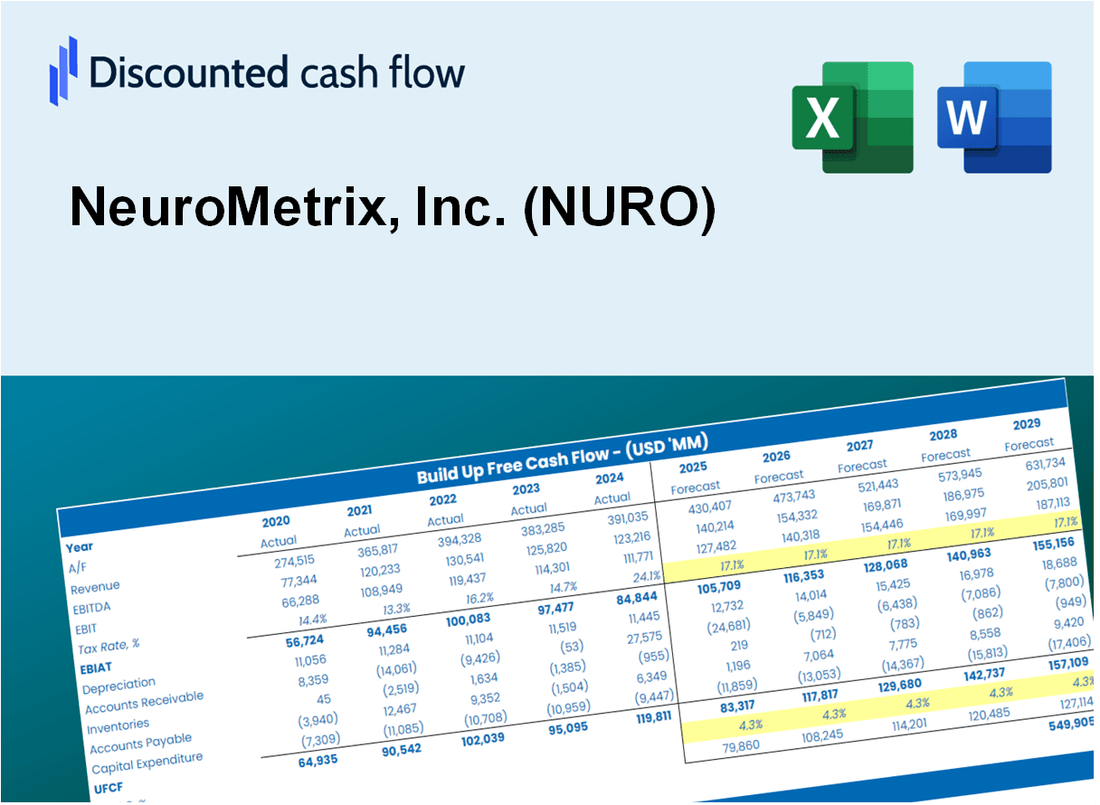
Discounted Cash Flow (DCF) - (USD MM)
| Year | AY1 2020 |
AY2 2021 |
AY3 2022 |
AY4 2023 |
AY5 2024 |
FY1 2025 |
FY2 2026 |
FY3 2027 |
FY4 2028 |
FY5 2029 |
|---|---|---|---|---|---|---|---|---|---|---|
| Revenue | 7.4 | 8.3 | 8.3 | 5.9 | 3.0 | 2.5 | 2.1 | 1.8 | 1.5 | 1.2 |
| Revenue Growth, % | 0 | 11.87 | 0.03125949 | -28.52 | -48.61 | -16.31 | -16.31 | -16.31 | -16.31 | -16.31 |
| EBITDA | -2.0 | -2.2 | -4.7 | -7.1 | -8.8 | -1.6 | -1.3 | -1.1 | -.9 | -.8 |
| EBITDA, % | -27.17 | -26.76 | -56.84 | -120.24 | -289.57 | -62.15 | -62.15 | -62.15 | -62.15 | -62.15 |
| Depreciation | .1 | .1 | .0 | .1 | .0 | .0 | .0 | .0 | .0 | .0 |
| Depreciation, % | 1.22 | 0.9254 | 0.59824 | 0.94404 | 0 | 0.73738 | 0.73738 | 0.73738 | 0.73738 | 0.73738 |
| EBIT | -2.1 | -2.3 | -4.7 | -7.2 | -8.8 | -1.6 | -1.3 | -1.1 | -.9 | -.8 |
| EBIT, % | -28.39 | -27.68 | -57.43 | -121.18 | -289.57 | -62.7 | -62.7 | -62.7 | -62.7 | -62.7 |
| Total Cash | 5.2 | 22.6 | 21.2 | 18.0 | 13.1 | 2.4 | 2.0 | 1.7 | 1.4 | 1.2 |
| Total Cash, percent | .0 | .0 | .0 | .0 | .0 | .0 | .0 | .0 | .0 | .0 |
| Account Receivables | .3 | .3 | .6 | .5 | .2 | .2 | .1 | .1 | .1 | .1 |
| Account Receivables, % | 4.53 | 3.77 | 7.83 | 8.79 | 6.36 | 6.26 | 6.26 | 6.26 | 6.26 | 6.26 |
| Inventories | 1.1 | .7 | 1.6 | 1.6 | 1.3 | .6 | .5 | .4 | .3 | .3 |
| Inventories, % | 14.25 | 8.56 | 19.56 | 26.42 | 44.43 | 22.65 | 22.65 | 22.65 | 22.65 | 22.65 |
| Accounts Payable | .1 | .3 | .4 | .2 | .4 | .1 | .1 | .1 | .1 | .1 |
| Accounts Payable, % | 1.93 | 3.44 | 4.46 | 3.65 | 11.98 | 5.09 | 5.09 | 5.09 | 5.09 | 5.09 |
| Capital Expenditure | .0 | -.1 | .0 | -.2 | .0 | .0 | .0 | .0 | .0 | .0 |
| Capital Expenditure, % | 0 | -1.6 | -0.28079 | -3.11 | 0 | -0.99735 | -0.99735 | -0.99735 | -0.99735 | -0.99735 |
| Tax Rate, % | 0 | 0 | 0 | 0 | 0 | 0 | 0 | 0 | 0 | 0 |
| EBITAT | -2.0 | -2.2 | -4.7 | -7.2 | -8.8 | -1.6 | -1.3 | -1.1 | -.9 | -.8 |
| Depreciation | ||||||||||
| Changes in Account Receivables | ||||||||||
| Changes in Inventories | ||||||||||
| Changes in Accounts Payable | ||||||||||
| Capital Expenditure | ||||||||||
| UFCF | -3.2 | -1.8 | -5.8 | -7.2 | -8.1 | -1.0 | -1.2 | -1.0 | -.9 | -.7 |
| WACC, % | 12.43 | 12.43 | 12.43 | 12.43 | 12.43 | 12.43 | 12.43 | 12.43 | 12.43 | 12.43 |
| PV UFCF | ||||||||||
| SUM PV UFCF | -3.5 | |||||||||
| Long Term Growth Rate, % | 2.00 | |||||||||
| Free cash flow (T + 1) | -1 | |||||||||
| Terminal Value | -7 | |||||||||
| Present Terminal Value | -4 | |||||||||
| Enterprise Value | -7 | |||||||||
| Net Debt | -1 | |||||||||
| Equity Value | -6 | |||||||||
| Diluted Shares Outstanding, MM | 2 | |||||||||
| Equity Value Per Share | -3.07 |
What You Will Get
- Real NeuroMetrix Data: Preloaded financials – from revenue to EBIT – based on actual and projected figures.
- Full Customization: Adjust all critical parameters (yellow cells) like WACC, growth %, and tax rates.
- Instant Valuation Updates: Automatic recalculations to analyze the impact of changes on NeuroMetrix’s fair value.
- Versatile Excel Template: Tailored for quick edits, scenario testing, and detailed projections.
- Time-Saving and Accurate: Skip building models from scratch while maintaining precision and flexibility.
Key Features
- Comprehensive NURO Data: Pre-filled with NeuroMetrix’s historical performance metrics and future growth projections.
- Customizable Parameters: Modify revenue forecasts, profit margins, discount rates, tax implications, and capital investment assumptions.
- Interactive Valuation Framework: Automatic recalculation of Net Present Value (NPV) and intrinsic value based on user-defined inputs.
- Multiple Scenario Analysis: Develop various forecasting scenarios to evaluate different valuation possibilities.
- Intuitive User Interface: Designed to be straightforward and accessible for both industry experts and newcomers.
How It Works
- Step 1: Download the Excel file.
- Step 2: Review pre-entered NeuroMetrix data (historical and projected).
- Step 3: Adjust key assumptions (yellow cells) based on your analysis.
- Step 4: View automatic recalculations for NeuroMetrix’s intrinsic value.
- Step 5: Use the outputs for investment decisions or reporting.
Why Choose This Calculator for NeuroMetrix, Inc. (NURO)?
- Accurate Data: Up-to-date NeuroMetrix financials provide trustworthy valuation outcomes.
- Customizable: Modify essential parameters such as growth rates, WACC, and tax rates to align with your forecasts.
- Time-Saving: Pre-configured calculations save you from starting from square one.
- Professional-Grade Tool: Tailored for investors, analysts, and consultants in the healthcare technology sector.
- User-Friendly: Easy-to-navigate design and clear instructions ensure accessibility for all users.
Who Should Use This Product?
- Investors: Accurately evaluate NeuroMetrix, Inc.'s (NURO) fair value before making investment choices.
- CFOs: Utilize a professional-grade DCF model for financial reporting and analysis specific to NeuroMetrix, Inc. (NURO).
- Consultants: Quickly customize the template for valuation reports tailored to NeuroMetrix, Inc. (NURO) clients.
- Entrepreneurs: Gain insights into financial modeling practices employed by leading companies like NeuroMetrix, Inc. (NURO).
- Educators: Employ it as a teaching resource to illustrate valuation methodologies relevant to NeuroMetrix, Inc. (NURO).
What the Template Contains
- Historical Data: Includes NeuroMetrix, Inc.'s (NURO) past financials and baseline forecasts.
- DCF and Levered DCF Models: Detailed templates to calculate NeuroMetrix, Inc.'s (NURO) intrinsic value.
- WACC Sheet: Pre-built calculations for Weighted Average Cost of Capital.
- Editable Inputs: Modify key drivers like growth rates, EBITDA %, and CAPEX assumptions.
- Quarterly and Annual Statements: A complete breakdown of NeuroMetrix, Inc.'s (NURO) financials.
- Interactive Dashboard: Visualize valuation results and projections dynamically.
Disclaimer
All information, articles, and product details provided on this website are for general informational and educational purposes only. We do not claim any ownership over, nor do we intend to infringe upon, any trademarks, copyrights, logos, brand names, or other intellectual property mentioned or depicted on this site. Such intellectual property remains the property of its respective owners, and any references here are made solely for identification or informational purposes, without implying any affiliation, endorsement, or partnership.
We make no representations or warranties, express or implied, regarding the accuracy, completeness, or suitability of any content or products presented. Nothing on this website should be construed as legal, tax, investment, financial, medical, or other professional advice. In addition, no part of this site—including articles or product references—constitutes a solicitation, recommendation, endorsement, advertisement, or offer to buy or sell any securities, franchises, or other financial instruments, particularly in jurisdictions where such activity would be unlawful.
All content is of a general nature and may not address the specific circumstances of any individual or entity. It is not a substitute for professional advice or services. Any actions you take based on the information provided here are strictly at your own risk. You accept full responsibility for any decisions or outcomes arising from your use of this website and agree to release us from any liability in connection with your use of, or reliance upon, the content or products found herein.