
|
Outfront Media Inc. (OUT) VALUATION DCF |
Entièrement Modifiable: Adapté À Vos Besoins Dans Excel Ou Sheets
Conception Professionnelle: Modèles Fiables Et Conformes Aux Normes Du Secteur
Pré-Construits Pour Une Utilisation Rapide Et Efficace
Compatible MAC/PC, entièrement débloqué
Aucune Expertise N'Est Requise; Facile À Suivre
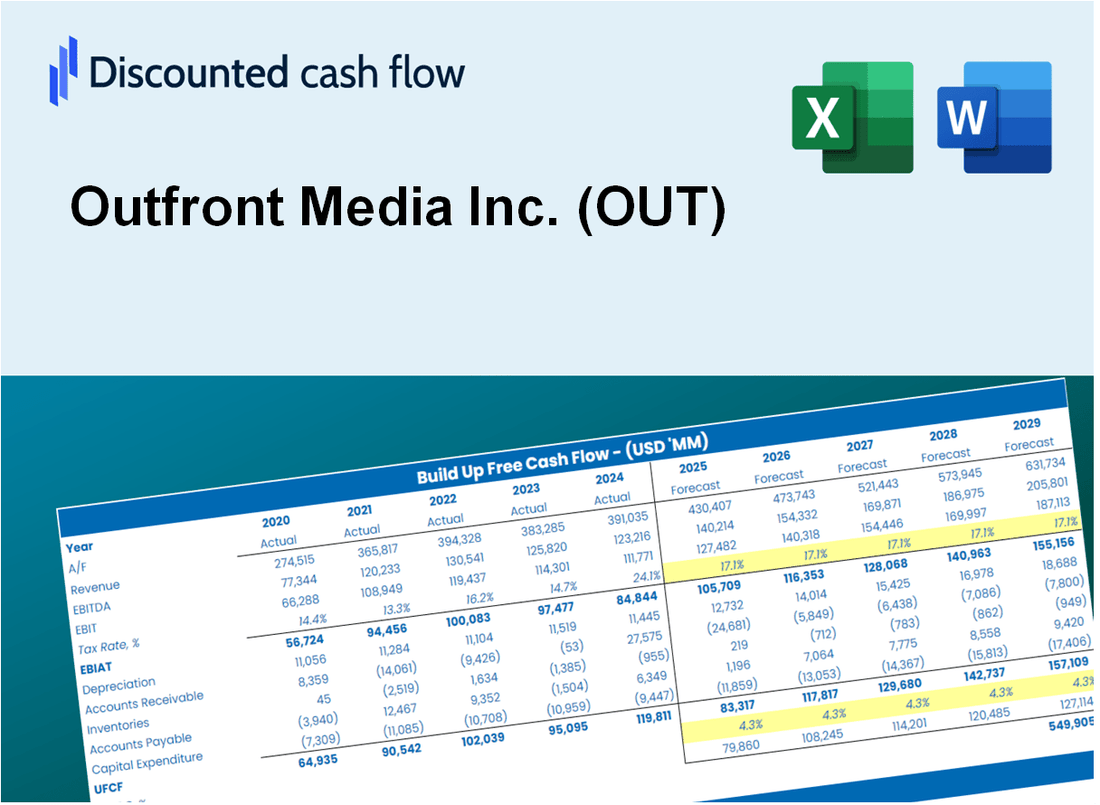
Outfront Media Inc. (OUT) Bundle
Simplifiez l'évaluation Outfront Media Inc. (Out) avec cette calculatrice DCF personnalisable! Doté de Real Outfront Media Inc. (OUT) Financials and Adjustable Prévision des intrants, vous pouvez tester les scénarios et découvrir Outfront Media Inc. (Out) FAIT VALUE en minutes.
Discounted Cash Flow (DCF) - (USD MM)
| Year | AY1 2020 |
AY2 2021 |
AY3 2022 |
AY4 2023 |
AY5 2024 |
FY1 2025 |
FY2 2026 |
FY3 2027 |
FY4 2028 |
FY5 2029 |
|---|---|---|---|---|---|---|---|---|---|---|
| Revenue | 1,236.3 | 1,463.9 | 1,772.1 | 1,820.6 | 1,830.9 | 2,026.6 | 2,243.3 | 2,483.2 | 2,748.7 | 3,042.5 |
| Revenue Growth, % | 0 | 18.41 | 21.05 | 2.74 | 0.56575 | 10.69 | 10.69 | 10.69 | 10.69 | 10.69 |
| EBITDA | 218.4 | 307.4 | 433.0 | -100.5 | 576.8 | 361.1 | 399.7 | 442.4 | 489.7 | 542.1 |
| EBITDA, % | 17.67 | 21 | 24.43 | -5.52 | 31.5 | 17.82 | 17.82 | 17.82 | 17.82 | 17.82 |
| Depreciation | 1,171.7 | 145.4 | 150.7 | 160.5 | 151.5 | 528.2 | 584.6 | 647.1 | 716.3 | 792.9 |
| Depreciation, % | 94.77 | 9.93 | 8.5 | 8.82 | 8.27 | 26.06 | 26.06 | 26.06 | 26.06 | 26.06 |
| EBIT | -953.3 | 162.0 | 282.3 | -261.0 | 425.3 | -167.1 | -184.9 | -204.7 | -226.6 | -250.8 |
| EBIT, % | -77.11 | 11.07 | 15.93 | -14.34 | 23.23 | -8.24 | -8.24 | -8.24 | -8.24 | -8.24 |
| Total Cash | 710.4 | 424.8 | 40.4 | 36.0 | 46.9 | 378.2 | 418.6 | 463.4 | 512.9 | 567.7 |
| Total Cash, percent | .0 | .0 | .0 | .0 | .0 | .0 | .0 | .0 | .0 | .0 |
| Account Receivables | 209.2 | 310.5 | 315.5 | 287.6 | 305.3 | 358.3 | 396.7 | 439.1 | 486.0 | 538.0 |
| Account Receivables, % | 16.92 | 21.21 | 17.8 | 15.8 | 16.67 | 17.68 | 17.68 | 17.68 | 17.68 | 17.68 |
| Inventories | .0 | .0 | .0 | .0 | .0 | .0 | .0 | .0 | .0 | .0 |
| Inventories, % | 0 | 0 | 0 | 0 | 0 | 0 | 0 | 0 | 0 | 0 |
| Accounts Payable | 64.9 | 64.9 | 65.4 | 55.5 | 51.4 | 77.9 | 86.3 | 95.5 | 105.7 | 117.0 |
| Accounts Payable, % | 5.25 | 4.43 | 3.69 | 3.05 | 2.81 | 3.85 | 3.85 | 3.85 | 3.85 | 3.85 |
| Capital Expenditure | -77.1 | -90.3 | -96.6 | -86.8 | -78.1 | -109.0 | -120.6 | -133.5 | -147.8 | -163.6 |
| Capital Expenditure, % | -6.24 | -6.17 | -5.45 | -4.77 | -4.27 | -5.38 | -5.38 | -5.38 | -5.38 | -5.38 |
| Tax Rate, % | 4.26 | 4.26 | 4.26 | 4.26 | 4.26 | 4.26 | 4.26 | 4.26 | 4.26 | 4.26 |
| EBITAT | -971.2 | 174.8 | 262.8 | -263.9 | 407.2 | -163.3 | -180.8 | -200.1 | -221.5 | -245.2 |
| Depreciation | ||||||||||
| Changes in Account Receivables | ||||||||||
| Changes in Inventories | ||||||||||
| Changes in Accounts Payable | ||||||||||
| Capital Expenditure | ||||||||||
| UFCF | -20.9 | 128.6 | 312.4 | -172.2 | 458.8 | 229.3 | 253.2 | 280.3 | 310.2 | 343.4 |
| WACC, % | 7.39 | 7.39 | 7.25 | 7.39 | 7.31 | 7.35 | 7.35 | 7.35 | 7.35 | 7.35 |
| PV UFCF | ||||||||||
| SUM PV UFCF | 1,134.4 | |||||||||
| Long Term Growth Rate, % | 3.00 | |||||||||
| Free cash flow (T + 1) | 354 | |||||||||
| Terminal Value | 8,133 | |||||||||
| Present Terminal Value | 5,705 | |||||||||
| Enterprise Value | 6,840 | |||||||||
| Net Debt | 3,966 | |||||||||
| Equity Value | 2,874 | |||||||||
| Diluted Shares Outstanding, MM | 167 | |||||||||
| Equity Value Per Share | 17.24 |
What You Will Get
- Pre-Filled Financial Model: Outfront Media Inc.'s (OUT) actual data facilitates accurate DCF valuation.
- Full Forecast Control: Modify revenue growth, margins, WACC, and other essential drivers.
- Instant Calculations: Automatic updates provide immediate results as you adjust inputs.
- Investor-Ready Template: A polished Excel file crafted for high-quality valuation presentations.
- Customizable and Reusable: Designed for adaptability, enabling repeated use for comprehensive forecasts.
Key Features
- Real-Life OUT Data: Pre-filled with Outfront Media's historical financials and future projections.
- Fully Customizable Inputs: Modify revenue growth, profit margins, WACC, tax rates, and capital expenditures.
- Dynamic Valuation Model: Automatic updates to Net Present Value (NPV) and intrinsic value based on your inputs.
- Scenario Testing: Generate multiple forecasting scenarios to evaluate various valuation outcomes.
- User-Friendly Design: Intuitive, structured, and suitable for both professionals and beginners.
How It Works
- Download the Template: Get instant access to the Excel-based OUT DCF Calculator.
- Input Your Assumptions: Adjust yellow-highlighted cells for growth rates, WACC, margins, and more.
- Instant Calculations: The model automatically updates Outfront Media's intrinsic value.
- Test Scenarios: Simulate different assumptions to evaluate potential valuation changes.
- Analyze and Decide: Use the results to guide your investment or financial analysis.
Why Choose This Calculator for Outfront Media Inc. (OUT)?
- Designed for Experts: A sophisticated tool tailored for analysts, CFOs, and industry consultants.
- Accurate Data: Outfront Media’s historical and projected financials are preloaded for precision.
- Forecast Simulation: Effortlessly test various scenarios and assumptions.
- Comprehensive Outputs: Automatically generates intrinsic value, NPV, and essential metrics.
- User-Friendly: Step-by-step guidance makes the process straightforward.
Who Should Use This Product?
- Marketing Professionals: Understand advertising strategies and analyze their effectiveness using real data from Outfront Media Inc. (OUT).
- Students: Integrate industry case studies into projects and academic research.
- Investors: Evaluate your investment strategies and assess valuation metrics for Outfront Media Inc. (OUT).
- Analysts: Enhance your analysis with a customizable advertising revenue model tailored for Outfront Media Inc. (OUT).
- Entrepreneurs: Discover how large-scale media companies like Outfront Media Inc. (OUT) approach market analysis.
What the Template Contains
- Operating and Balance Sheet Data: Pre-filled Outfront Media Inc. (OUT) historical data and forecasts, including revenue, EBITDA, EBIT, and capital expenditures.
- WACC Calculation: A dedicated sheet for Weighted Average Cost of Capital (WACC), including parameters like Beta, risk-free rate, and share price.
- DCF Valuation (Unlevered and Levered): Editable Discounted Cash Flow models showing intrinsic value with detailed calculations.
- Financial Statements: Pre-loaded financial statements (annual and quarterly) to support analysis.
- Key Ratios: Includes profitability, leverage, and efficiency ratios for Outfront Media Inc. (OUT).
- Dashboard and Charts: Visual summary of valuation outputs and assumptions to analyze results easily.
Disclaimer
All information, articles, and product details provided on this website are for general informational and educational purposes only. We do not claim any ownership over, nor do we intend to infringe upon, any trademarks, copyrights, logos, brand names, or other intellectual property mentioned or depicted on this site. Such intellectual property remains the property of its respective owners, and any references here are made solely for identification or informational purposes, without implying any affiliation, endorsement, or partnership.
We make no representations or warranties, express or implied, regarding the accuracy, completeness, or suitability of any content or products presented. Nothing on this website should be construed as legal, tax, investment, financial, medical, or other professional advice. In addition, no part of this site—including articles or product references—constitutes a solicitation, recommendation, endorsement, advertisement, or offer to buy or sell any securities, franchises, or other financial instruments, particularly in jurisdictions where such activity would be unlawful.
All content is of a general nature and may not address the specific circumstances of any individual or entity. It is not a substitute for professional advice or services. Any actions you take based on the information provided here are strictly at your own risk. You accept full responsibility for any decisions or outcomes arising from your use of this website and agree to release us from any liability in connection with your use of, or reliance upon, the content or products found herein.