
|
Royal Caribbean Cruises Ltd. (RCL) Évaluation DCF |
Entièrement Modifiable: Adapté À Vos Besoins Dans Excel Ou Sheets
Conception Professionnelle: Modèles Fiables Et Conformes Aux Normes Du Secteur
Pré-Construits Pour Une Utilisation Rapide Et Efficace
Compatible MAC/PC, entièrement débloqué
Aucune Expertise N'Est Requise; Facile À Suivre
Royal Caribbean Cruises Ltd. (RCL) Bundle
Vous cherchez à évaluer la valeur intrinsèque de Royal Caribbean Cruises Ltd.? Notre calculatrice RCL DCF intègre des données réelles avec des fonctionnalités de personnalisation étendues, vous permettant d'affiner vos prévisions et de faire des choix d'investissement plus éclairés.
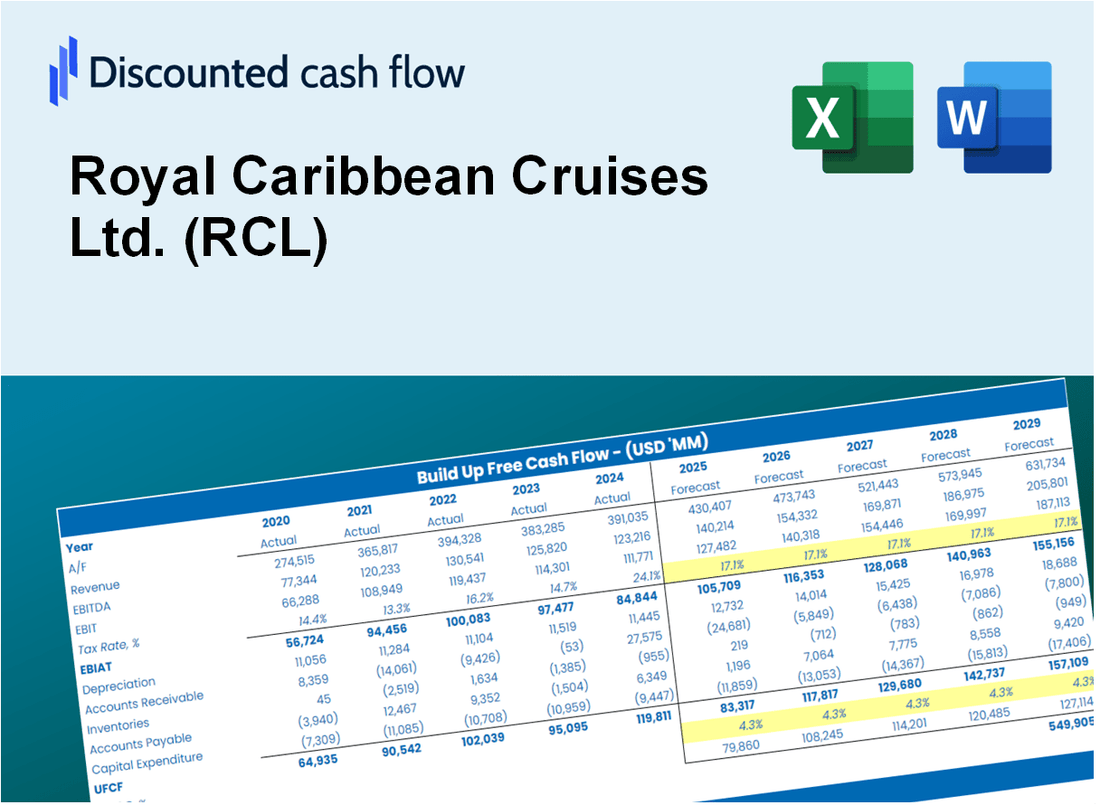
Discounted Cash Flow (DCF) - (USD MM)
| Year | AY1 2020 |
AY2 2021 |
AY3 2022 |
AY4 2023 |
AY5 2024 |
FY1 2025 |
FY2 2026 |
FY3 2027 |
FY4 2028 |
FY5 2029 |
|---|---|---|---|---|---|---|---|---|---|---|
| Revenue | 2,208.8 | 1,532.0 | 8,840.0 | 13,900.0 | 16,485.0 | 22,468.9 | 30,624.8 | 41,741.3 | 56,893.0 | 77,544.5 |
| Revenue Growth, % | 0 | -30.64 | 477.02 | 57.24 | 18.6 | 36.3 | 36.3 | 36.3 | 36.3 | 36.3 |
| EBITDA | -3,651.6 | -2,675.0 | 615.0 | 4,561.0 | 6,087.0 | -5,541.1 | -7,552.4 | -10,293.9 | -14,030.4 | -19,123.3 |
| EBITDA, % | -165.32 | -174.61 | 6.96 | 32.81 | 36.92 | -24.66 | -24.66 | -24.66 | -24.66 | -24.66 |
| Depreciation | 1,279.3 | 1,293.0 | 1,407.0 | 1,455.0 | 1,600.0 | 8,017.1 | 10,927.3 | 14,893.7 | 20,300.0 | 27,668.7 |
| Depreciation, % | 57.92 | 84.4 | 15.92 | 10.47 | 9.71 | 35.68 | 35.68 | 35.68 | 35.68 | 35.68 |
| EBIT | -4,930.9 | -3,968.0 | -792.0 | 3,106.0 | 4,487.0 | -7,162.9 | -9,762.9 | -13,306.7 | -18,136.9 | -24,720.5 |
| EBIT, % | -223.24 | -259.01 | -8.96 | 22.35 | 27.22 | -31.88 | -31.88 | -31.88 | -31.88 | -31.88 |
| Total Cash | 3,684.5 | 2,701.8 | 1,935.0 | 497.0 | 388.0 | 10,237.6 | 13,953.8 | 19,018.9 | 25,922.5 | 35,332.1 |
| Total Cash, percent | .0 | .0 | .0 | .0 | .0 | .0 | .0 | .0 | .0 | .0 |
| Account Receivables | 284.1 | 408.1 | 531.0 | 405.0 | 371.0 | 2,277.1 | 3,103.6 | 4,230.2 | 5,765.7 | 7,858.6 |
| Account Receivables, % | 12.86 | 26.64 | 6.01 | 2.91 | 2.25 | 10.13 | 10.13 | 10.13 | 10.13 | 10.13 |
| Inventories | 118.7 | 150.2 | 224.0 | 248.0 | 265.0 | 948.4 | 1,292.7 | 1,761.9 | 2,401.5 | 3,273.2 |
| Inventories, % | 5.37 | 9.81 | 2.53 | 1.78 | 1.61 | 4.22 | 4.22 | 4.22 | 4.22 | 4.22 |
| Accounts Payable | 353.4 | 546.0 | 647.0 | 792.0 | 919.0 | 3,156.0 | 4,301.6 | 5,863.0 | 7,991.2 | 10,892.0 |
| Accounts Payable, % | 16 | 35.64 | 7.32 | 5.7 | 5.57 | 14.05 | 14.05 | 14.05 | 14.05 | 14.05 |
| Capital Expenditure | -1,965.1 | -2,230.0 | -2,710.0 | -3,897.0 | -3,268.0 | -12,020.1 | -16,383.3 | -22,330.3 | -30,436.0 | -41,483.9 |
| Capital Expenditure, % | -88.97 | -145.56 | -30.66 | -28.04 | -19.82 | -53.5 | -53.5 | -53.5 | -53.5 | -53.5 |
| Tax Rate, % | 0.69037 | 0.69037 | 0.69037 | 0.69037 | 0.69037 | 0.69037 | 0.69037 | 0.69037 | 0.69037 | 0.69037 |
| EBITAT | -4,950.0 | -3,968.0 | -792.0 | 3,093.2 | 4,456.0 | -7,147.1 | -9,741.4 | -13,277.4 | -18,097.0 | -24,666.0 |
| Depreciation | ||||||||||
| Changes in Account Receivables | ||||||||||
| Changes in Inventories | ||||||||||
| Changes in Accounts Payable | ||||||||||
| Capital Expenditure | ||||||||||
| UFCF | -5,685.3 | -4,867.9 | -2,190.7 | 898.2 | 2,932.0 | -11,502.6 | -15,222.7 | -20,748.4 | -28,279.8 | -38,545.1 |
| WACC, % | 11.57 | 11.57 | 11.57 | 11.57 | 11.56 | 11.57 | 11.57 | 11.57 | 11.57 | 11.57 |
| PV UFCF | ||||||||||
| SUM PV UFCF | -78,024.6 | |||||||||
| Long Term Growth Rate, % | 2.00 | |||||||||
| Free cash flow (T + 1) | -39,316 | |||||||||
| Terminal Value | -410,803 | |||||||||
| Present Terminal Value | -237,622 | |||||||||
| Enterprise Value | -315,646 | |||||||||
| Net Debt | 20,432 | |||||||||
| Equity Value | -336,078 | |||||||||
| Diluted Shares Outstanding, MM | 279 | |||||||||
| Equity Value Per Share | -1,204.58 |
What You Will Get
- Real RCL Financials: Access to both historical and projected data for precise valuation.
- Customizable Inputs: Adjust WACC, tax rates, revenue growth, and capital expenditures as needed.
- Dynamic Calculations: Intrinsic value and NPV are computed in real-time.
- Scenario Analysis: Explore various scenarios to assess Royal Caribbean’s future performance.
- User-Friendly Design: Designed for professionals while remaining approachable for newcomers.
Key Features
- Customizable Revenue Assumptions: Adjust key inputs such as ticket sales growth, onboard spending, and operational costs.
- Instant DCF Valuation: Automatically computes intrinsic value, NPV, and additional financial metrics.
- Industry-Leading Precision: Utilizes Royal Caribbean's (RCL) actual financial data for accurate valuation results.
- Effortless Scenario Analysis: Evaluate various scenarios and assess their impacts with ease.
- Efficiency Booster: Skip the complexities of creating detailed valuation models from the ground up.
How It Works
- 1. Open the Template: Download and open the Excel file containing Royal Caribbean Cruises Ltd.'s (RCL) preloaded data.
- 2. Edit Assumptions: Modify key inputs such as growth rates, WACC, and capital expenditures.
- 3. View Results Instantly: The DCF model automatically calculates intrinsic value and NPV.
- 4. Test Scenarios: Evaluate multiple forecasts to explore various valuation outcomes.
- 5. Use with Confidence: Present professional valuation insights to bolster your decision-making.
Why Choose This Calculator?
- Accuracy: Up-to-date Royal Caribbean financials ensure precise data.
- Flexibility: Tailored for users to easily adjust and test various inputs.
- Time-Saving: Eliminate the need to construct a DCF model from the ground up.
- Professional-Grade: Crafted with the precision and usability expected at the CFO level.
- User-Friendly: Intuitive design makes it accessible for users without advanced financial modeling skills.
Who Should Use This Product?
- Cruise Enthusiasts: Discover the latest trends and offerings from Royal Caribbean Cruises Ltd. (RCL).
- Travel Agents: Enhance your knowledge of cruise packages and itineraries to better serve clients.
- Investors: Evaluate investment opportunities and analyze financial performance for Royal Caribbean Cruises Ltd. (RCL).
- Market Analysts: Utilize industry data to assess market trends and forecasts related to the cruise sector.
- Tourism Professionals: Understand how major players like Royal Caribbean Cruises Ltd. (RCL) impact the travel industry.
What the Template Contains
- Pre-Filled DCF Model: Royal Caribbean Cruises Ltd. (RCL)’s financial data preloaded for immediate use.
- WACC Calculator: Detailed calculations for Weighted Average Cost of Capital.
- Financial Ratios: Evaluate Royal Caribbean’s profitability, leverage, and efficiency.
- Editable Inputs: Change assumptions such as growth, margins, and CAPEX to fit your scenarios.
- Financial Statements: Annual and quarterly reports to support detailed analysis.
- Interactive Dashboard: Easily visualize key valuation metrics and results.
Disclaimer
All information, articles, and product details provided on this website are for general informational and educational purposes only. We do not claim any ownership over, nor do we intend to infringe upon, any trademarks, copyrights, logos, brand names, or other intellectual property mentioned or depicted on this site. Such intellectual property remains the property of its respective owners, and any references here are made solely for identification or informational purposes, without implying any affiliation, endorsement, or partnership.
We make no representations or warranties, express or implied, regarding the accuracy, completeness, or suitability of any content or products presented. Nothing on this website should be construed as legal, tax, investment, financial, medical, or other professional advice. In addition, no part of this site—including articles or product references—constitutes a solicitation, recommendation, endorsement, advertisement, or offer to buy or sell any securities, franchises, or other financial instruments, particularly in jurisdictions where such activity would be unlawful.
All content is of a general nature and may not address the specific circumstances of any individual or entity. It is not a substitute for professional advice or services. Any actions you take based on the information provided here are strictly at your own risk. You accept full responsibility for any decisions or outcomes arising from your use of this website and agree to release us from any liability in connection with your use of, or reliance upon, the content or products found herein.