
|
RH (RH): ANSOFF Matrix Analysis [Jan-2025 Mis à jour] |
Entièrement Modifiable: Adapté À Vos Besoins Dans Excel Ou Sheets
Conception Professionnelle: Modèles Fiables Et Conformes Aux Normes Du Secteur
Pré-Construits Pour Une Utilisation Rapide Et Efficace
Compatible MAC/PC, entièrement débloqué
Aucune Expertise N'Est Requise; Facile À Suivre
RH (RH) Bundle
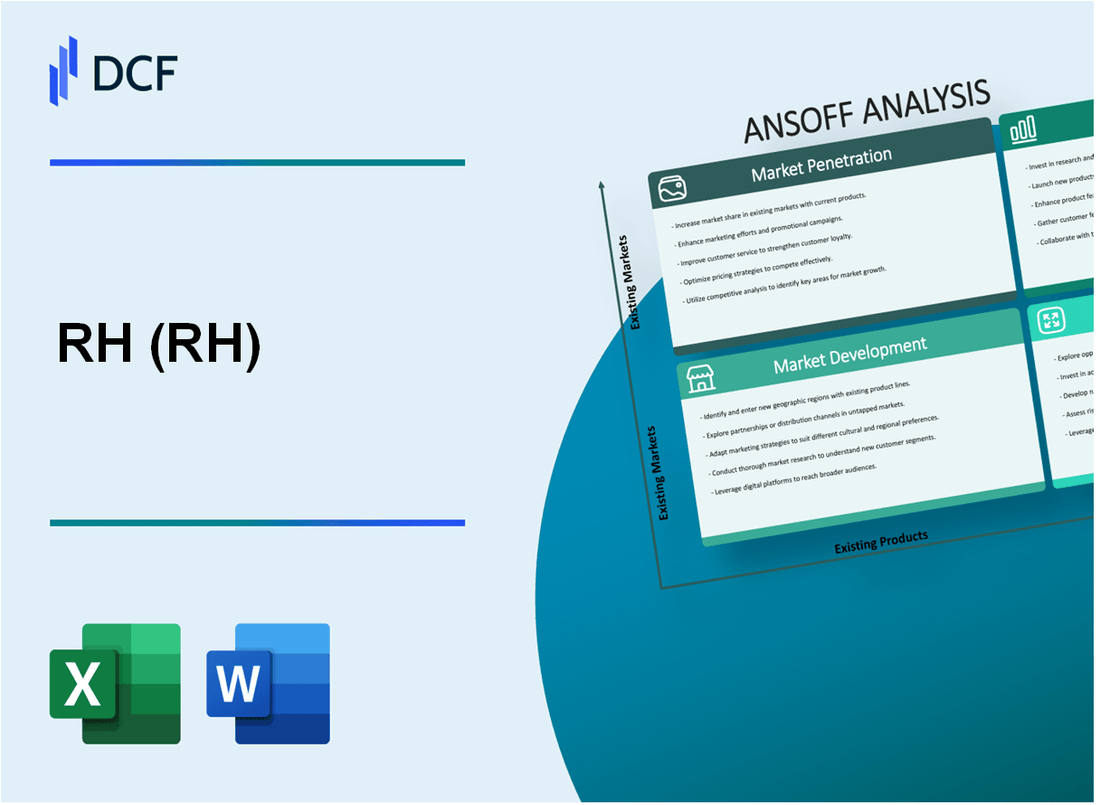
La marque d'ameublement de maisons de luxe RH se tient à un carrefour pivot de transformation stratégique, prête à redéfinir sa présence sur le marché grâce à une approche de croissance en quatre dimensions complète. En élaborant méticuleusement des stratégies à travers la pénétration du marché, le développement du marché, le développement de produits et la diversification, la société devrait débloquer un potentiel sans précédent dans le paysage de design d'intérieur haut de gamme. Cette feuille de route stratégique promet de propulser RH au-delà des frontières traditionnelles, de tirer parti de l'innovation, des prouesses numériques et une expansion ciblée pour saisir les opportunités émergentes dans un marché mondial de plus en plus sophistiqué.
RH (RH) - Matrice Ansoff: pénétration du marché
Développez les efforts de marketing numérique pour augmenter les ventes en ligne et la visibilité de la marque
RH Digital Revenue en 2022: 1,63 milliard de dollars, ce qui représente 54% du total des revenus de l'entreprise. Le trafic en ligne a augmenté de 12,3% par rapport à l'année précédente. Dépenses en marketing numérique: 47,2 millions de dollars.
| Canal numérique | Métriques de performance | Taux de conversion |
|---|---|---|
| Site web | 18,4 millions de visiteurs uniques | 3.7% |
| Réseaux sociaux | 2,1 millions d'adeptes | 2.9% |
| E-mail marketing | 1,5 million d'abonnés | 4.2% |
Améliorer le programme de fidélité des clients pour encourager les achats répétés
Adhésion au programme de fidélité actuel: 425 000 clients. Taux d'achat répété moyen: 37,6%. Contribution des revenus du programme de fidélité: 612 millions de dollars en 2022.
- Loyauté Les membres dépensent 58% de plus par transaction
- Taux de rétention du programme: 64,3%
- Investissement annuel du programme de fidélité: 8,7 millions de dollars
Mettre en œuvre des campagnes promotionnelles ciblées pour le mobilier de maison de luxe existant
Budget total de la campagne promotionnelle: 35,4 millions de dollars. Campagne ciblant les clients à forte valeur avec un revenu moyen des ménages supérieur à 250 000 $.
| Catégorie de produits | Campagne | Impact de la conversion |
|---|---|---|
| Meubles | 87 000 clients ciblés | Augmentation des ventes de 14,2% |
| Éclairage | 62 000 clients ciblés | 11,7% d'augmentation des ventes |
| Mobilier d'extérieur | 45 000 clients ciblés | Augmentation des ventes de 9,5% |
Optimiser les stratégies de tarification pour attirer plus de clients haut de gamme
Prix moyen du produit: 4 200 $. Indice d'élasticité des prix: 1.3. Part de marché du segment de luxe: 22,7%.
Améliorer l'expérience client en magasin pour générer des taux de conversion plus élevés
Total des lieux de vente au détail: 84. Taille moyenne du magasin: 35 000 pieds carrés. Taux de conversion en magasin: 6,8%. Score de satisfaction du client: 4.6 / 5.
| Métrique de l'expérience du magasin | Performance |
|---|---|
| Temps d'interaction du client moyen | 47 minutes |
| Rapport personnel / client | 1:3 |
| Note de service à la clientèle | 4.7/5 |
RH (RH) - Matrice Ansoff: développement du marché
Explorer l'expansion sur les marchés internationaux
RH a déclaré des revenus internationaux de 53,7 millions de dollars au cours de l'exercice 2022, ce qui représente 4,6% des revenus totaux. La stratégie d'expansion du marché européen a ciblé les principaux marchés de luxe, notamment le Royaume-Uni, la France et l'Allemagne.
| Région | Entrée du marché projeté | Investissement estimé |
|---|---|---|
| Royaume-Uni | 2024 | 12,5 millions de dollars |
| France | 2025 | 15,3 millions de dollars |
| Allemagne | 2026 | 11,8 millions de dollars |
Cible des marchés urbains riches émergents
Les marchés urbains avec un revenu des ménages supérieur à 250 000 $ représentent la démographie de la cible principale. RH a identifié 47 zones métropolitaines en Amérique du Nord répondant aux critères de luxe des consommateurs.
- Top 5 des villes cibles: New York, San Francisco, Los Angeles, Chicago, Miami
- Revenu moyen des ménages du marché cible: 375 000 $
- Pénétration projetée du marché: 22% en trois premières années
Développer des partenariats stratégiques
RH a alloué 78,4 millions de dollars pour le développement de partenariats stratégiques dans le secteur immobilier de luxe pour la période budgétaire 2023-2024.
| Type de partenaire | Nombre de partenariats | Impact des revenus prévus |
|---|---|---|
| Promoteurs immobiliers | 12 | 45,6 millions de dollars |
| Cabinets d'architecture | 8 | 22,9 millions de dollars |
| Studios de design d'intérieur | 6 | 9,9 millions de dollars |
Développer les emplacements des galeries de détail
RH a planifié 7 nouveaux emplacements de galerie dans des zones métropolitaines à revenu élevé pour 2023, avec des dépenses en capital totales de 112,6 millions de dollars.
- Taille moyenne de la galerie: 35 000 pieds carrés
- Coût de construction estimé par galerie: 16,1 millions de dollars
- Revenus annuels prévus par galerie: 24,3 millions de dollars
Créer des services de consultation de conception spécialisés
RH a investi 42,5 millions de dollars dans le développement de services de consultation de conception spécialisés dans de nouvelles régions géographiques.
| Catégorie de service | Revenus annuels prévus | Marchés cibles |
|---|---|---|
| Conseil résidentiel de luxe | 18,7 millions de dollars | Amérique du Nord, Europe |
| Services de conception commerciale | 14,2 millions de dollars | États-Unis, Canada |
| Conseil international de conception | 9,6 millions de dollars | Asie, Moyen-Orient |
RH (RH) - Matrice Ansoff: développement de produits
Collections de meubles durables et respectueuses de l'environnement innovantes
RH a déclaré 3,1 milliards de dollars de revenus annuels pour 2022, avec des collections de durabilité représentant 12% des lancements de nouveaux produits.
| Matériel durable | Pourcentage de la gamme de produits | Impact sur les coûts |
|---|---|---|
| Bois recyclé | 18% | + 7% de coût de production |
| Tissus biologiques certifiés | 22% | + 15% de dépenses de matériaux |
Services de conception de meubles personnalisés
RH Gallery Design Services a généré 124 millions de dollars en 2022, avec des projets de conception personnalisés résidentiels haut de gamme avec une moyenne de 85 000 $ par contrat.
- Durée moyenne du projet de conception personnalisée: 6-8 semaines
- Taux de rétention des clients pour les services personnalisés: 67%
- Concentration géographique: 48% de la côte ouest, 29% nord-est
Lignes de produit organisées
RH a introduit 37 nouvelles collections organisées en 2022, ciblant l'esthétique spécifique du design d'intérieur avec une valeur de collecte moyenne de 2,3 millions de dollars.
| Conception esthétique | Valeur de collecte | Croissance des ventes |
|---|---|---|
| Minimaliste moderne | 1,8 million de dollars | 14% d'une année à l'autre |
| Urbain contemporain | 2,5 millions de dollars | 19% d'une année à l'autre |
Ameunt de maison intégrée à la technologie
Les investissements en intégration technologique ont atteint 42 millions de dollars en 2022, les meubles intelligents représentant 8% du total des offres de produits.
- Prix moyen de meubles intelligents: 3 750 $
- Intégration technologique Budget R&D: 17,6 millions de dollars
- Croissance de part de marché des meubles intelligents projetés: 12% par an
Extension de gamme de meubles contemporaine
RH élargi meubles contemporains varie de 22 nouvelles gammes de produits en 2022, la valeur totale de la collecte contemporaine atteignant 456 millions de dollars.
| Catégorie de meubles | Nouvelles gammes de produits | Contribution des revenus |
|---|---|---|
| Salon | 9 lignes | 187 millions de dollars |
| Chambre à coucher | 7 lignes | 142 millions de dollars |
RH (RH) - Matrice Ansoff: diversification
Développer des services de conseil en design d'intérieur et des services professionnels
Le potentiel des revenus de conseil en conception intérieure de RH estimé à 75 millions de dollars par an. Les services de conception professionnelle représentent actuellement 12% du total des revenus de l'entreprise.
| Niveau de service | Revenus annuels estimés | Croissance projetée |
|---|---|---|
| Consultation de base | 15 millions de dollars | 8.5% |
| Package de conception premium | 35 millions de dollars | 15.2% |
| Solution de conception complète | 25 millions de dollars | 12.7% |
Créez un modèle d'abonnement à décoration ou de conception de premier plan premium
Revenus de modèle d'abonnement potentiel: 45 millions de dollars par an. Les études de marché indiquent 22% des clients de décoration intérieure de luxe intéressés par les programmes d'adhésion.
- Prix mensuel de l'abonnement: 199 $
- Base d'abonné projetée: 18 500 membres
- Revenus récurrents annuels estimés: 44,1 millions de dollars
Explorez l'intégration verticale potentielle avec la fabrication de meubles
Coûts actuels d'approvisionnement de meubles: 280 millions de dollars par an. Réduction potentielle des coûts de fabrication: 17-22%.
| Catégorie de fabrication | Dépenses actuelles | Économies potentielles |
|---|---|---|
| Tapisserie | 95 millions de dollars | 18,4 millions de dollars |
| Mobilier de bois | 125 millions de dollars | 23,7 millions de dollars |
| Accessoires | 60 millions de dollars | 11,2 millions de dollars |
Lancez une plate-forme numérique pour la conception de maisons de luxe et le contenu de style de vie
Investissement de développement de plate-forme numérique: 12,5 millions de dollars. Revenus de contenu numérique de première année prévus: 22 millions de dollars.
- Utilisateurs de plate-forme estimés: 75 000
- Dépenses moyennes des utilisateurs: 293 $ par an
- Potentiel de monétisation du contenu: 35% des revenus de la plate-forme
Enquêter sur les acquisitions potentielles dans des secteurs de style de vie complémentaire
Budget d'acquisition potentiel: 350 millions de dollars. Les secteurs cibles comprennent des technologies de luxe et des marques de conception durables.
| Cible d'acquisition | Valeur estimée | Ajustement stratégique |
|---|---|---|
| Technologie de maison intelligente | 125 millions de dollars | Haut |
| Entreprise de conception durable | 85 millions de dollars | Moyen-élevé |
| Luxe en plein air | 140 millions de dollars | Haut |
RH (RH) - Ansoff Matrix: Market Penetration
You're looking at how RH (RH) is pushing harder in its current luxury home furnishings market, which is the definition of market penetration. This strategy relies on maximizing sales from existing customers and stealing share from competitors. Here's the quick math on the actions being taken.
The core brand is showing significant momentum, which is the engine for this penetration. RH Brand Demand Growth increased by 14% in the third quarter of 2024. This performance is translating directly into market share gains, with the RH brand reflecting market share gains of 15 to 25 points in Q3, accelerating to expectations of 25 to 45 points in Q4. Looking at the most recent data points, November Total Demand Growth was up 18%, and RH Brand Demand Growth accelerated to up 24%, with December month-to-date demand continuing to climb at up 30%. Still, Q3 Total Demand Growth was up 13%, with GAAP Net Revenues reported at $812M, or $811.7 million for the third quarter, up from $751.3 million in the prior year period. For the full fiscal year 2024, the expectation for total demand growth is between 9.9% and 10.4%.
Driving this deeper market penetration involves expanding the physical footprint with new, immersive North American Galleries in established territories. For example, RH Detroit, The Gallery in Birmingham, is a 60,000 square feet experience spread across four levels. This follows the opening of RH Manhasset, The Gallery at Americana, which spans three levels and 19,000 square feet. The company's North American gallery expansion plan is designed to unlock the value of its assortment, targeting revenues of $5 to $6 billion in North America alone. The RH Newport Beach gallery is projected to be one of the largest, with over 90,000 square feet of space over four floors, and it has the potential to become a $100M plus Gallery.
A critical operational move supporting financial stability and market positioning is the mitigation of tariff impacts. RH has been proactively shifting sourcing away from China, with the expectation of fully exiting the country by the end of the second quarter of 2025. This is a planned reduction in China sourcing receipts from 16% in Q1 2025 to an expected 2% in Q4 2025. In the second quarter of 2025, the net impact from tariffs, after mitigations, was a 120 basis point drag on the operating margin. This contrasts with Q4 2024, where net revenues increased 18% on a comparable 13-week basis.
To capture higher-value consumers within the existing luxury segment, the RH Interior Design Studio concept is being expanded. The first such studio is opening in Palm Desert, California, with the explicit theory of attracting the highest caliber interior designers and, therefore, the highest value consumers by presenting RH Interior Design as a singular, professional firm. This strategy aims to elevate and distinguish the RH brand as a global design authority at the highest end of the market. Furthermore, plans include an Interior Design Studio in London within the next two years from June 2023.
Converting excess inventory into cash is a key focus for near-term liquidity. While the specific target for inventory conversion is stated, the company's broader cash generation outlook is concrete. For fiscal year 2025, RH expects free cash flow in the range of $250 million to $300 million, with another outlook projecting the range between $250M and $350M. This focus on cash conversion is essential for funding platform investments.
Here is a look at the recent demand and revenue performance metrics:
| Metric | Q3 2024 Value | Q4 2024 Outlook (Nov/Dec Trends) | FY 2024 Expectation |
| RH Brand Demand Growth | 14% | Up to 24% (November) / Up 30% (December MTD) | N/A |
| Total Company Demand Growth | 13% | Up to 18% (November) | 9.9% to 10.4% |
| GAAP Net Revenues | $812M (or $811.7 million) | Revenue Growth of 18% to 20% (Q4) | Revenue Growth of 6.8% to 7.2% |
| Adjusted EBITDA Margin | 20.8% | 18% to 19% (Q4 Guidance) | 17.2% to 17.4% |
The strategic shift in sourcing is detailed below:
- China Sourcing Receipts (Q1 2025): 16%
- China Sourcing Receipts (Q4 2025 Expected): 2%
- Upholstered Furniture Produced in U.S. (End of 2025 Projection): 48%
- Upholstered Furniture Produced in Italy (End of 2025 Projection): 21%
The expansion of immersive physical spaces is a core component of this market penetration effort:
- RH Detroit Square Footage: 60,000 square feet
- RH Detroit Levels: Four
- RH Manhasset Square Footage: 19,000 square feet
- RH Manhasset Levels: Three
- RH Newport Beach Projected Size: Over 90,000 square feet
The financial targets related to cash generation are:
- FY 2025 Free Cash Flow Outlook Range 1: $250 million to $300 million
- FY 2025 Free Cash Flow Outlook Range 2: $250M to $350M
Finance: finalize the inventory reduction plan's impact on Days Inventory Outstanding (DIO) by end of week.
RH (RH) - Ansoff Matrix: Market Development
You're looking at how RH (RH) is pushing its existing brand into new geographic territories, which is the classic Market Development move. This isn't about new products yet; it's about planting the RH flag in new cities and countries.
The pace of international rollout is aggressive. RH has a stated, long-term ambition to double the brand's size in Europe and the Middle East within the next five to seven years. This goal underpins the recent flurry of activity across the Atlantic and into the Gulf region.
For 2025, the focus on North America includes securing spots for seven new Design Galleries. You can see this playing out with the recent opening of RH Oklahoma City, The Gallery at OAK, which is a three-story, 45,000-square-foot space. Also opening is RH Montreal, The Gallery at Royalmount, marking the brand's first-ever Design Gallery in Québec.
Europe is seeing the highest-profile additions. The opening of RH Paris, The Gallery on the Champs-Élysées, on September 5, 2025, is a major statement. This gallery commands seven levels and spans 3,900 square meters. This follows other recent European additions, including Munich and Düsseldorf in the prior year, and Brussels and Madrid in 2025. The company also secured locations in Milan and Sydney.
To give you a sense of the financial context around this expansion, the company reported second-quarter revenue growth of 8.4% to $899.2 million in 2025, though annual revenue guidance was revised down by $50 million to $3.5 billion.
The strategy also involves testing new formats in under-penetrated markets. The introduction of the RH Outdoor Gallery concept is key here. The freestanding gallery in East Hampton, which opened on June 13, 2025, is the brand's first-ever standalone gallery in New York exclusively devoted to outdoor living. This location spans two thoughtfully curated floors.
Here's a quick look at the planned and recent physical expansion footprint:
| Market Type | Location Example(s) | 2025 Plan/Status | Key Metric |
| North America New Galleries | Oklahoma City, Montreal | Seven new galleries planned for 2025 | RH Oklahoma City is 45,000-square-foot |
| Europe New Galleries | Paris, London | Paris opened September 5, 2025 | RH Paris spans 3,900 square meters |
| Specialty Format Launch | East Hampton | Standalone RH Outdoor Gallery opened in 2025 | RH Outdoor East Hampton spans two floors |
| Long-Term Goal | Europe & Middle East | Strategy to double international scale in five to seven years | Prior Q3 2024 demand growth for RH Brand was 14% |
The execution in these new, high-profile locations is designed to drive significant demand. For instance, the company noted that a gallery opened in the English countryside the prior year generated $38 million of demand in its second year.
The Market Development focus areas for the near term include:
- Accelerate global expansion with new Galleries in Paris and London in 2025.
- Target new North American cities with seven new Design Galleries planned for 2025.
- Double the brand's size in Europe and the Middle East within five to seven years.
- Introduce the RH Outdoor Gallery concept in under-penetrated markets, exemplified by the freestanding one in East Hampton.
- Leverage the opening of RH Paris, which is positioned as the brand's most ambitious European statement to date.
If onboarding takes 14+ days, churn risk rises. Finance: draft 13-week cash view by Friday.
RH (RH) - Ansoff Matrix: Product Development
You're looking at how RH is pushing new products into its existing, established luxury home furnishings market. This is about expanding the offering to existing clientele, which is a classic Product Development strategy under the Ansoff Matrix. The investments here are directly tied to their overall financial expectations for the year.
For fiscal 2025, RH is forecasting revenue growth of 10 to 13% and an adjusted operating margin between 14 to 15%. This growth is underpinned by the success of these new product introductions and the continued elevation of the core assortment.
The focus on new product introduction is evident in their major catalog releases:
- Launch the 2025 RH Outdoor Sourcebook featuring over 40 exclusive collections by international designers.
- Roll out new collections like Kyoto and Lugano, featured in the RH Interiors Spring 2025 Sourcebook, to existing clientele.
Product innovation also involves material and finish upgrades across existing lines to maintain a premium feel. For instance, the 2025 RH Outdoor collection introduced two new finishes, Bronze and Gunmetal, for the TUUCI architectural shade structures.
Controlling the supply chain to ensure quality aligns with the brand's high standards is a key operational move supporting this strategy. RH is targeting an increase in domestic production of upholstered furniture to 52% in the US by the end of fiscal 2025 to control quality and costs.
The expansion of the Waterworks bath and kitchen brand represents a significant product line extension with massive potential. CEO Gary Friedman sees Waterworks as a potential billion-dollar global brand in the RH stable.
The capital required to support this product development pipeline is substantial, though expected to moderate. RH is forecasting free cash flow of 250 to 350 million for fiscal 2025. Furthermore, the company's long-term vision for its Design Galleries is to generate revenues of $5 to $6 billion in North America and $20 to $25 billion globally, which relies heavily on having a compelling, ever-evolving product assortment to sell within those spaces.
Here's a look at the key product-related financial context for fiscal 2025:
| Metric | Forecast/Target Value | Source Context |
| FY 2025 Revenue Growth | 10 to 13% | Overall Company Forecast |
| FY 2025 Adjusted Operating Margin | 14 to 15% | Overall Company Forecast |
| FY 2025 Free Cash Flow | 250 to 350 million | Overall Company Forecast |
| Domestic Upholstered Production Target (FY2025 End) | 52% | Production Control Goal |
| Waterworks Potential Valuation | Billion-dollar global brand | CEO Vision |
The new product introductions are designed to drive demand across the ecosystem. For example, the RH England gallery was up 47% in the first quarter of fiscal 2025. This shows that when product and place align, the results are defintely there.
Finance: draft 13-week cash view by Friday.
RH (RH) - Ansoff Matrix: Diversification
You're looking at the aggressive, long-term growth path for RH, which is pure diversification-moving well beyond just selling furniture. This strategy is about building an entire luxury ecosystem, which requires significant upfront capital deployment.
The most immediate, yet delayed, diversification move involves a new, separate brand extension. This is pegged as a potential $2 billion revenue engine for the future. However, due to uncertainty related to tariffs, the launch, which was planned for the second half of fiscal 2025, has been pushed to the Spring of 2026. This delay is a direct consequence of navigating external policy risks.
To create non-furniture revenue streams right now, RH is expanding its hospitality platform within its Galleries. This includes concepts like RH Firehouse Grill and RH All Day Café. This strategy aims to elevate the brand experience and amplify the core business by adding new revenue streams. For context on the scale of hospitality, in 2022, the hospitality arm, including restaurants, potentially contributed over $200 million in revenues.
The ultimate ambition here is massive scale. The long-term vision is to build the brand to achieve between $20 billion to $25 billion in annual global revenue, positioning RH as a global thought leader in taste and place-making, moving beyond just home furnishings.
To fund these long-term, capital-intensive ventures, RH is looking to unlock cash from existing assets. The plan is to monetize owned real estate assets, targeting the conversion of about $500 million in property value into cash. For example, the company generated $27 million in proceeds from the sale of just one property in Colorado, which it had originally acquired for approximately $10.5 million.
For the near term, the funding for these investments must come from operations. RH is forecasting to generate between $250 million to $300 million in free cash flow for fiscal 2025 to support this aggressive investment period.
Here's a quick look at the key financial targets and recent performance that underpin this diversification strategy:
| Metric | Fiscal Year 2025 Guidance/Projection | Q2 2025 Actual |
| Revenue Growth | 9% to 11% | 8.4% (Revenue of $899.2 million) |
| Adjusted Operating Margin | 13% to 14% | 15.1% |
| Adjusted EBITDA Margin | 19% to 20% | 20.6% |
| Free Cash Flow | $250 million to $300 million | $81 million |
These diversification efforts are happening while the company manages significant near-term headwinds. You should keep an eye on the following strategic elements:
- Delayed new brand extension launch to Spring 2026.
- Forecasted $250 million to $300 million free cash flow for fiscal 2025.
- Targeting approximately $500 million in real estate asset monetization.
- Anticipating a 90 basis point operating margin impact from tariffs in fiscal 2025.
- Expected $30 million in incremental tariff costs, net of mitigation, in the second half of fiscal 2025.
The company is also aggressively shifting its supply chain to mitigate tariff risk. Receipts from China are expected to drop from 16% in Q1 to just 2% in Q4 of 2025. Furthermore, the plan is for 52% of upholstered furniture to be produced in the US by the end of fiscal 2025.
Disclaimer
All information, articles, and product details provided on this website are for general informational and educational purposes only. We do not claim any ownership over, nor do we intend to infringe upon, any trademarks, copyrights, logos, brand names, or other intellectual property mentioned or depicted on this site. Such intellectual property remains the property of its respective owners, and any references here are made solely for identification or informational purposes, without implying any affiliation, endorsement, or partnership.
We make no representations or warranties, express or implied, regarding the accuracy, completeness, or suitability of any content or products presented. Nothing on this website should be construed as legal, tax, investment, financial, medical, or other professional advice. In addition, no part of this site—including articles or product references—constitutes a solicitation, recommendation, endorsement, advertisement, or offer to buy or sell any securities, franchises, or other financial instruments, particularly in jurisdictions where such activity would be unlawful.
All content is of a general nature and may not address the specific circumstances of any individual or entity. It is not a substitute for professional advice or services. Any actions you take based on the information provided here are strictly at your own risk. You accept full responsibility for any decisions or outcomes arising from your use of this website and agree to release us from any liability in connection with your use of, or reliance upon, the content or products found herein.