
|
Rush Enterprises, Inc. (RUSHA) Valation DCF |
Entièrement Modifiable: Adapté À Vos Besoins Dans Excel Ou Sheets
Conception Professionnelle: Modèles Fiables Et Conformes Aux Normes Du Secteur
Pré-Construits Pour Une Utilisation Rapide Et Efficace
Compatible MAC/PC, entièrement débloqué
Aucune Expertise N'Est Requise; Facile À Suivre
Rush Enterprises, Inc. (RUSHA) Bundle
Évaluez les perspectives financières de Rush Enterprises, Inc. comme un expert! Cette calculatrice DCF (RUSHA) fournit des finances pré-remplies et la flexibilité pour personnaliser la croissance des revenus, le WACC, les marges et d'autres hypothèses critiques pour s'aligner sur vos prédictions.
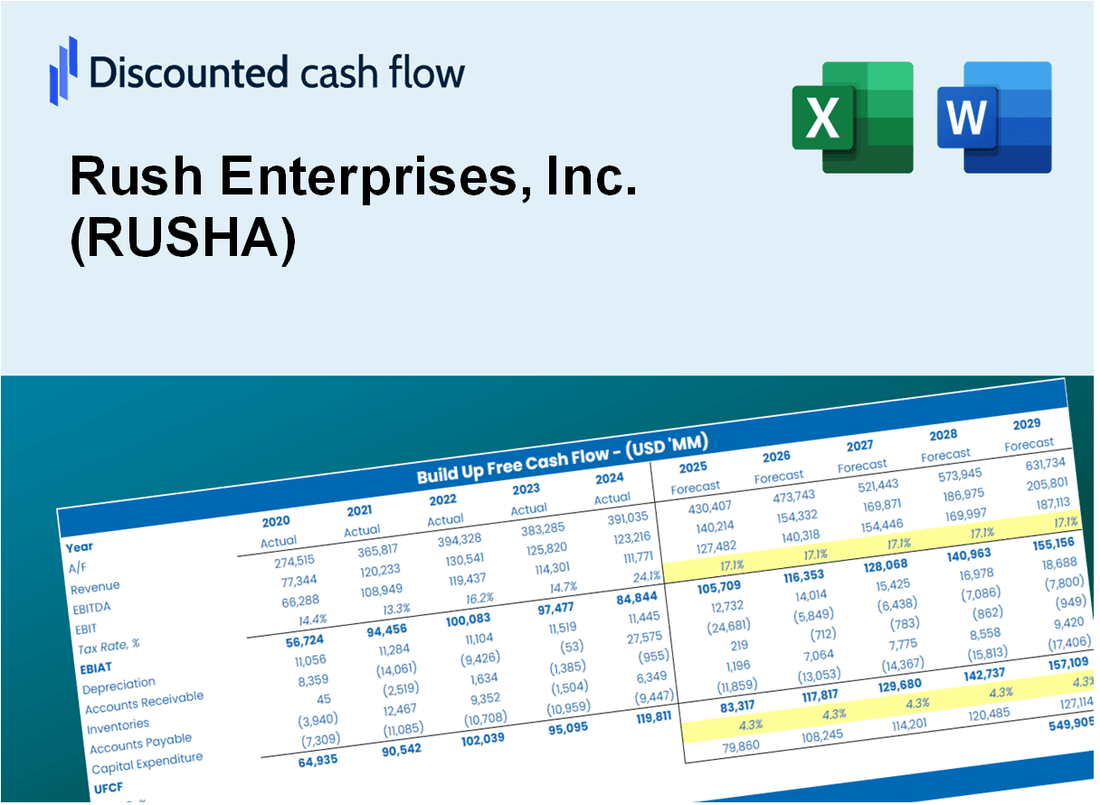
Discounted Cash Flow (DCF) - (USD MM)
| Year | AY1 2020 |
AY2 2021 |
AY3 2022 |
AY4 2023 |
AY5 2024 |
FY1 2025 |
FY2 2026 |
FY3 2027 |
FY4 2028 |
FY5 2029 |
|---|---|---|---|---|---|---|---|---|---|---|
| Revenue | 4,735.9 | 5,126.1 | 7,101.7 | 7,925.0 | 7,804.7 | 8,914.1 | 10,181.1 | 11,628.1 | 13,280.9 | 15,168.5 |
| Revenue Growth, % | 0 | 8.24 | 38.54 | 11.59 | -1.52 | 14.21 | 14.21 | 14.21 | 14.21 | 14.21 |
| EBITDA | 330.1 | 477.1 | 702.8 | 736.9 | 705.9 | 793.7 | 906.5 | 1,035.3 | 1,182.5 | 1,350.5 |
| EBITDA, % | 6.97 | 9.31 | 9.9 | 9.3 | 9.05 | 8.9 | 8.9 | 8.9 | 8.9 | 8.9 |
| Depreciation | 177.3 | 169.5 | 199.1 | 221.1 | 236.1 | 279.4 | 319.1 | 364.4 | 416.2 | 475.4 |
| Depreciation, % | 3.74 | 3.31 | 2.8 | 2.79 | 3.03 | 3.13 | 3.13 | 3.13 | 3.13 | 3.13 |
| EBIT | 152.8 | 307.6 | 503.7 | 515.8 | 469.8 | 514.3 | 587.4 | 670.9 | 766.2 | 875.1 |
| EBIT, % | 3.23 | 6 | 7.09 | 6.51 | 6.02 | 5.77 | 5.77 | 5.77 | 5.77 | 5.77 |
| Total Cash | 312.0 | 148.1 | 201.0 | 183.7 | 228.1 | 312.9 | 357.4 | 408.2 | 466.2 | 532.5 |
| Total Cash, percent | .0 | .0 | .0 | .0 | .0 | .0 | .0 | .0 | .0 | .0 |
| Account Receivables | 172.5 | 140.2 | 220.7 | 259.4 | 354.9 | 308.5 | 352.3 | 402.4 | 459.6 | 524.9 |
| Account Receivables, % | 3.64 | 2.73 | 3.11 | 3.27 | 4.55 | 3.46 | 3.46 | 3.46 | 3.46 | 3.46 |
| Inventories | 858.3 | 1,020.1 | 1,429.4 | 1,801.4 | 1,787.7 | 1,850.4 | 2,113.4 | 2,413.7 | 2,756.8 | 3,148.6 |
| Inventories, % | 18.12 | 19.9 | 20.13 | 22.73 | 22.91 | 20.76 | 20.76 | 20.76 | 20.76 | 20.76 |
| Accounts Payable | 110.7 | 122.3 | 171.7 | 162.1 | 244.0 | 219.5 | 250.7 | 286.4 | 327.1 | 373.6 |
| Accounts Payable, % | 2.34 | 2.39 | 2.42 | 2.05 | 3.13 | 2.46 | 2.46 | 2.46 | 2.46 | 2.46 |
| Capital Expenditure | -136.2 | -167.2 | -243.1 | -368.9 | -433.0 | -352.3 | -402.4 | -459.6 | -524.9 | -599.5 |
| Capital Expenditure, % | -2.88 | -3.26 | -3.42 | -4.65 | -5.55 | -3.95 | -3.95 | -3.95 | -3.95 | -3.95 |
| Tax Rate, % | 23.54 | 23.54 | 23.54 | 23.54 | 23.54 | 23.54 | 23.54 | 23.54 | 23.54 | 23.54 |
| EBITAT | 115.7 | 236.7 | 387.0 | 387.4 | 359.2 | 392.0 | 447.7 | 511.3 | 584.0 | 667.0 |
| Depreciation | ||||||||||
| Changes in Account Receivables | ||||||||||
| Changes in Inventories | ||||||||||
| Changes in Accounts Payable | ||||||||||
| Capital Expenditure | ||||||||||
| UFCF | -763.2 | 121.1 | -97.2 | -180.7 | 162.3 | 278.3 | 88.7 | 101.3 | 115.7 | 132.2 |
| WACC, % | 6.52 | 6.53 | 6.53 | 6.51 | 6.52 | 6.52 | 6.52 | 6.52 | 6.52 | 6.52 |
| PV UFCF | ||||||||||
| SUM PV UFCF | 609.6 | |||||||||
| Long Term Growth Rate, % | 2.00 | |||||||||
| Free cash flow (T + 1) | 135 | |||||||||
| Terminal Value | 2,982 | |||||||||
| Present Terminal Value | 2,174 | |||||||||
| Enterprise Value | 2,784 | |||||||||
| Net Debt | 1,506 | |||||||||
| Equity Value | 1,278 | |||||||||
| Diluted Shares Outstanding, MM | 82 | |||||||||
| Equity Value Per Share | 15.62 |
What You Will Receive
- Pre-Filled Financial Model: Rush Enterprises, Inc.'s (RUSHA) actual data allows for accurate DCF valuation.
- Comprehensive Forecast Control: Modify revenue growth, profit margins, WACC, and other essential drivers.
- Real-Time Calculations: Automatic updates provide immediate results as you make adjustments.
- Professional-Grade Template: An enhanced Excel file crafted for high-quality valuation.
- Flexible and Reusable: Designed for adaptability, enabling repeated use for in-depth forecasts.
Key Features
- Comprehensive DCF Calculator: Features detailed unlevered and levered DCF valuation models tailored for Rush Enterprises, Inc. (RUSHA).
- WACC Calculation Tool: Pre-configured Weighted Average Cost of Capital sheet with options for customization.
- Customizable Forecast Inputs: Adjust growth projections, capital expenditures, and discount rates as needed.
- Integrated Financial Ratios: Evaluate profitability, leverage, and efficiency ratios specific to Rush Enterprises, Inc. (RUSHA).
- Interactive Dashboard and Charts: Visual representations of key valuation metrics for straightforward analysis.
How It Works
- Download: Obtain the ready-to-use Excel file featuring Rush Enterprises, Inc.'s (RUSHA) financial data.
- Customize: Modify projections, including revenue growth, EBITDA %, and WACC.
- Update Automatically: The intrinsic value and NPV calculations refresh in real-time.
- Test Scenarios: Develop multiple forecasts and evaluate results instantly.
- Make Decisions: Utilize the valuation findings to inform your investment approach.
Why Choose This Calculator for Rush Enterprises, Inc. (RUSHA)?
- Designed for Industry Experts: A sophisticated tool tailored for analysts, CFOs, and industry consultants.
- Accurate Financial Data: Rush Enterprises’ historical and projected financials preloaded for reliable insights.
- Flexible Scenario Analysis: Effortlessly simulate various forecasts and assumptions.
- Comprehensive Outputs: Automatically computes intrinsic value, NPV, and essential financial metrics.
- User-Friendly: Step-by-step guidance to facilitate your analysis process.
Who Should Use This Product?
- Investors: Assess Rush Enterprises’ valuation prior to making stock transactions.
- CFOs and Financial Analysts: Optimize valuation methodologies and evaluate financial forecasts.
- Startup Founders: Understand the valuation strategies of established companies like Rush Enterprises.
- Consultants: Create comprehensive valuation reports for your clientele.
- Students and Educators: Utilize real-time data to learn and instruct on valuation practices.
What the Template Contains
- Preloaded RUSHA Data: Historical and projected financial data, including revenue, EBIT, and capital expenditures.
- DCF and WACC Models: Professional-grade sheets for calculating intrinsic value and Weighted Average Cost of Capital.
- Editable Inputs: Yellow-highlighted cells for adjusting revenue growth, tax rates, and discount rates.
- Financial Statements: Comprehensive annual and quarterly financials for deeper analysis.
- Key Ratios: Profitability, leverage, and efficiency ratios to evaluate performance.
- Dashboard and Charts: Visual summaries of valuation outcomes and assumptions.
Disclaimer
All information, articles, and product details provided on this website are for general informational and educational purposes only. We do not claim any ownership over, nor do we intend to infringe upon, any trademarks, copyrights, logos, brand names, or other intellectual property mentioned or depicted on this site. Such intellectual property remains the property of its respective owners, and any references here are made solely for identification or informational purposes, without implying any affiliation, endorsement, or partnership.
We make no representations or warranties, express or implied, regarding the accuracy, completeness, or suitability of any content or products presented. Nothing on this website should be construed as legal, tax, investment, financial, medical, or other professional advice. In addition, no part of this site—including articles or product references—constitutes a solicitation, recommendation, endorsement, advertisement, or offer to buy or sell any securities, franchises, or other financial instruments, particularly in jurisdictions where such activity would be unlawful.
All content is of a general nature and may not address the specific circumstances of any individual or entity. It is not a substitute for professional advice or services. Any actions you take based on the information provided here are strictly at your own risk. You accept full responsibility for any decisions or outcomes arising from your use of this website and agree to release us from any liability in connection with your use of, or reliance upon, the content or products found herein.