
|
Savencia SA (Save.PA) Valation DCF |
Entièrement Modifiable: Adapté À Vos Besoins Dans Excel Ou Sheets
Conception Professionnelle: Modèles Fiables Et Conformes Aux Normes Du Secteur
Pré-Construits Pour Une Utilisation Rapide Et Efficace
Compatible MAC/PC, entièrement débloqué
Aucune Expertise N'Est Requise; Facile À Suivre
Savencia SA (SAVE.PA) Bundle
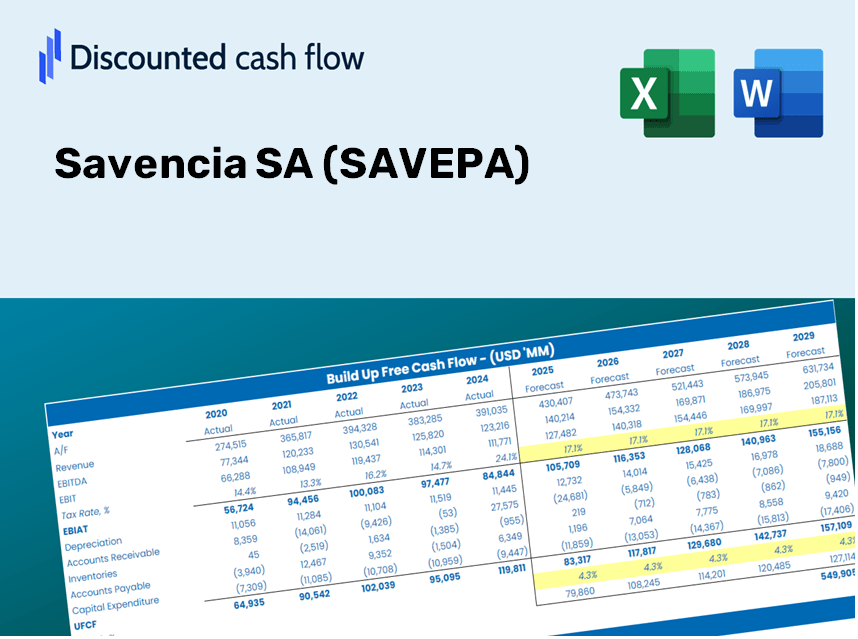
Gardez un aperçu de votre analyse d'évaluation de Savencia SA (SAVEPA) à l'aide de notre calculatrice DCF à la pointe de la technologie! Équipée de données réelles SAVEPA, ce modèle Excel vous permet d'ajuster les prévisions et les hypothèses pour déterminer avec précision la valeur intrinsèque de Savenccia SA.
Benefits You'll Receive
- Comprehensive SAVEPA Financials: Provides historical and projected data for precise valuation.
- Customizable Inputs: Adjust WACC, tax rates, revenue growth, and capital expenditures to fit your analysis.
- Dynamically Updated Calculations: Intrinsic value and NPV are automatically calculated based on your inputs.
- Scenario Analysis: Evaluate various scenarios to assess Savencia's future growth.
- User-Friendly and Professional Design: Tailored for experts while remaining easy to navigate for newcomers.
Key Features
- 🔍 Real-Life SAVENCIA Financials: Pre-filled historical and projected data for Savencia SA (SAVEPA).
- ✏️ Fully Customizable Inputs: Adjust all critical parameters (yellow cells) such as WACC, growth %, and tax rates.
- 📊 Professional DCF Valuation: Built-in formulas calculate Savencia’s intrinsic value using the Discounted Cash Flow method.
- ⚡ Instant Results: Visualize Savencia’s valuation immediately after making adjustments.
- Scenario Analysis: Test and compare outcomes for various financial assumptions side-by-side.
How It Functions
- Step 1: Download the Excel spreadsheet.
- Step 2: Examine the pre-filled data for Savencia SA (SAVEPA) including historical and projected figures.
- Step 3: Modify key assumptions (highlighted in yellow) according to your analysis.
- Step 4: Observe the automatic updates for Savencia SA's intrinsic value.
- Step 5: Utilize the results for making investment decisions or for reporting purposes.
Why Choose This Calculator for Savencia SA (SAVEPA)?
- Designed for Experts: A sophisticated tool favored by analysts, CFOs, and industry consultants.
- Comprehensive Data: Savencia's historical and projected financial information preloaded for precision.
- Flexible Scenario Analysis: Effortlessly test various forecasts and assumptions.
- Transparent Results: Automatically computes intrinsic value, NPV, and essential metrics.
- User-Friendly: Step-by-step guidance ensures a seamless experience throughout.
Who Can Benefit from This Product?
- Professional Investors: Develop comprehensive and trustworthy valuation models for analyzing portfolios involving Savencia SA (SAVEPA).
- Corporate Finance Teams: Evaluate valuation scenarios to inform strategic decision-making within the organization.
- Consultants and Advisors: Equip clients with precise valuation insights for Savencia SA (SAVEPA) stock.
- Students and Educators: Utilize real-world data to enhance practical learning in financial modeling.
- Food Industry Enthusiasts: Gain insights into the market valuation of companies like Savencia SA (SAVEPA) in the food sector.
Contents of the Template
- Operating and Balance Sheet Data: Pre-filled historical data and forecasts for Savencia SA (SAVEPA), including revenue, EBITDA, EBIT, and capital expenditures.
- WACC Calculation: A dedicated sheet for Weighted Average Cost of Capital (WACC), featuring parameters such as Beta, risk-free rate, and share price.
- DCF Valuation (Unlevered and Levered): Customizable Discounted Cash Flow models illustrating intrinsic value along with comprehensive calculations.
- Financial Statements: Pre-loaded annual and quarterly financial statements to aid in analysis.
- Key Ratios: Includes profitability, leverage, and efficiency ratios specific to Savencia SA (SAVEPA).
- Dashboard and Charts: A visual overview of valuation outcomes and assumptions to facilitate result analysis.
Disclaimer
All information, articles, and product details provided on this website are for general informational and educational purposes only. We do not claim any ownership over, nor do we intend to infringe upon, any trademarks, copyrights, logos, brand names, or other intellectual property mentioned or depicted on this site. Such intellectual property remains the property of its respective owners, and any references here are made solely for identification or informational purposes, without implying any affiliation, endorsement, or partnership.
We make no representations or warranties, express or implied, regarding the accuracy, completeness, or suitability of any content or products presented. Nothing on this website should be construed as legal, tax, investment, financial, medical, or other professional advice. In addition, no part of this site—including articles or product references—constitutes a solicitation, recommendation, endorsement, advertisement, or offer to buy or sell any securities, franchises, or other financial instruments, particularly in jurisdictions where such activity would be unlawful.
All content is of a general nature and may not address the specific circumstances of any individual or entity. It is not a substitute for professional advice or services. Any actions you take based on the information provided here are strictly at your own risk. You accept full responsibility for any decisions or outcomes arising from your use of this website and agree to release us from any liability in connection with your use of, or reliance upon, the content or products found herein.