
|
Sterling Bancorp, Inc. (Southfield, MI) (SBT) DCF Valation |
Entièrement Modifiable: Adapté À Vos Besoins Dans Excel Ou Sheets
Conception Professionnelle: Modèles Fiables Et Conformes Aux Normes Du Secteur
Pré-Construits Pour Une Utilisation Rapide Et Efficace
Compatible MAC/PC, entièrement débloqué
Aucune Expertise N'Est Requise; Facile À Suivre
Sterling Bancorp, Inc. (Southfield, MI) (SBT) Bundle
Découvrez le véritable potentiel de Sterling Bancorp, Inc. (SBT) avec notre calculatrice avancée DCF! Ajustez les hypothèses clés, explorez divers scénarios et évaluez comment les différents facteurs affectent l'évaluation de Sterling Bancorp - le tout dans un seul modèle Excel.
What You Will Receive
- Customizable Excel Template: A fully editable Excel-based DCF Calculator featuring pre-filled real SBT financials.
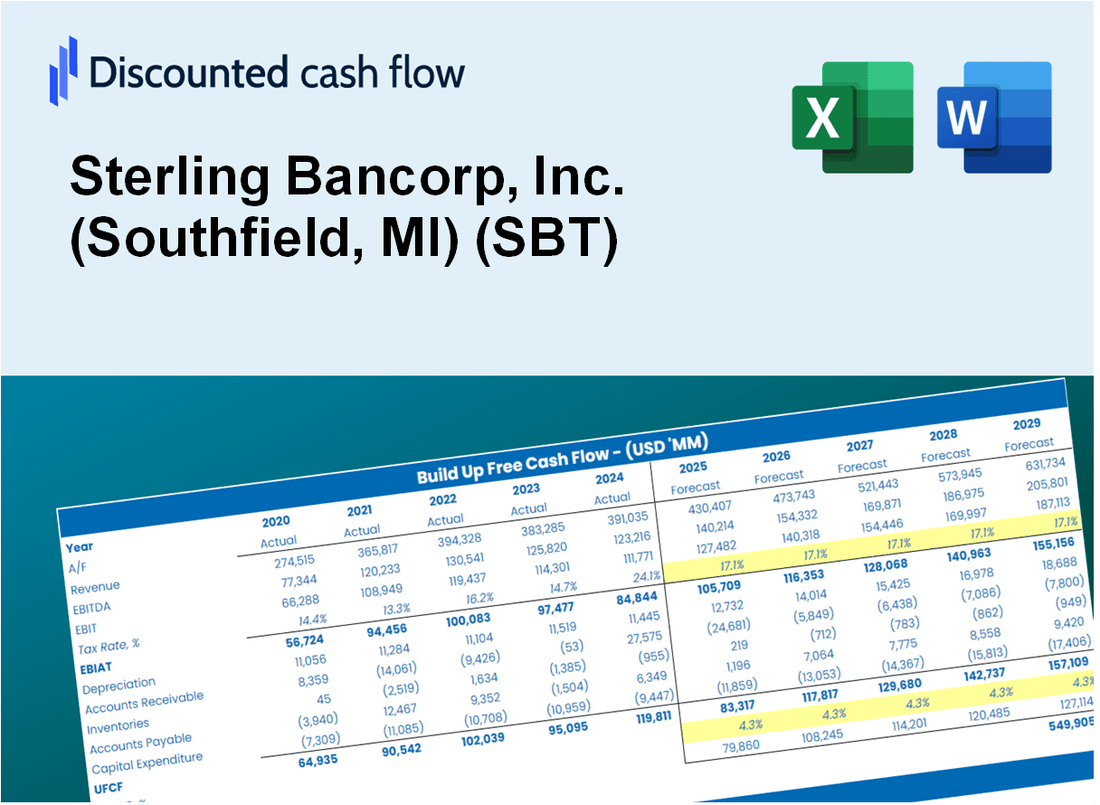
- Authentic Data: Access to historical data and forward-looking projections (highlighted in the yellow cells).
- Adjustable Forecasts: Modify forecast assumptions such as revenue growth, EBITDA %, and WACC as needed.
- Instant Calculations: Quickly observe how your inputs affect Sterling Bancorp's valuation.
- Professional Resource: Designed for investors, CFOs, consultants, and financial analysts.
- Intuitive Layout: Organized for clarity and ease of navigation, complete with step-by-step guidance.
Key Features
- Comprehensive Financial Data: Sterling Bancorp’s historical financial statements and pre-filled projections.
- Customizable Parameters: Adjust WACC, tax rates, revenue growth, and EBITDA margins as needed.
- Real-Time Valuation: Instantly view Sterling Bancorp’s intrinsic value updates.
- Intuitive Visualizations: Dashboard graphs showcase valuation outcomes and essential metrics.
- Designed for Precision: A reliable tool tailored for analysts, investors, and finance professionals.
How It Works
- 1. Access the Template: Download and open the Excel file containing Sterling Bancorp, Inc.'s (SBT) financial data.
- 2. Modify Key Inputs: Adjust essential parameters such as growth rates, WACC, and capital expenditures.
- 3. Analyze Results in Real-Time: The DCF model automatically computes intrinsic value and NPV based on your inputs.
- 4. Explore Various Scenarios: Evaluate different forecasts to understand a range of valuation possibilities.
- 5. Make Informed Decisions: Present expert valuation analyses to back your strategic choices.
Why Choose This Calculator for Sterling Bancorp, Inc. (SBT)?
- Designed for Financial Experts: A sophisticated tool utilized by analysts, CFOs, and financial consultants.
- Accurate Financial Data: Sterling Bancorp’s historical and projected financials are preloaded for precision.
- Flexible Scenario Analysis: Easily simulate various forecasts and assumptions for strategic planning.
- Intuitive Outputs: Automatically computes intrinsic value, NPV, and essential financial metrics.
- User-Friendly Interface: Step-by-step guidance ensures a smooth calculation process.
Who Should Use Sterling Bancorp, Inc. (SBT)?
- Individual Investors: Gain insights to make informed decisions about investing in Sterling Bancorp, Inc. stock.
- Financial Analysts: Enhance analysis with comprehensive financial models tailored for Sterling Bancorp, Inc.
- Consultants: Provide expert valuation assessments to clients with speed and precision.
- Business Owners: Learn from the valuation strategies of established firms like Sterling Bancorp, Inc. to refine your own business approach.
- Finance Students: Explore valuation methodologies through real data and case studies relevant to Sterling Bancorp, Inc.
What the Template Contains
- Historical Data: Includes Sterling Bancorp’s past financials and baseline forecasts.
- DCF and Levered DCF Models: Detailed templates to calculate Sterling Bancorp’s intrinsic value.
- WACC Sheet: Pre-built calculations for Weighted Average Cost of Capital.
- Editable Inputs: Modify key drivers like growth rates, net interest margin %, and loan loss provisions assumptions.
- Quarterly and Annual Statements: A complete breakdown of Sterling Bancorp’s financials.
- Interactive Dashboard: Visualize valuation results and projections dynamically.
Disclaimer
All information, articles, and product details provided on this website are for general informational and educational purposes only. We do not claim any ownership over, nor do we intend to infringe upon, any trademarks, copyrights, logos, brand names, or other intellectual property mentioned or depicted on this site. Such intellectual property remains the property of its respective owners, and any references here are made solely for identification or informational purposes, without implying any affiliation, endorsement, or partnership.
We make no representations or warranties, express or implied, regarding the accuracy, completeness, or suitability of any content or products presented. Nothing on this website should be construed as legal, tax, investment, financial, medical, or other professional advice. In addition, no part of this site—including articles or product references—constitutes a solicitation, recommendation, endorsement, advertisement, or offer to buy or sell any securities, franchises, or other financial instruments, particularly in jurisdictions where such activity would be unlawful.
All content is of a general nature and may not address the specific circumstances of any individual or entity. It is not a substitute for professional advice or services. Any actions you take based on the information provided here are strictly at your own risk. You accept full responsibility for any decisions or outcomes arising from your use of this website and agree to release us from any liability in connection with your use of, or reliance upon, the content or products found herein.