
|
Schaeffler India Limited (Schaeffler.NS) Évaluation DCF |
Entièrement Modifiable: Adapté À Vos Besoins Dans Excel Ou Sheets
Conception Professionnelle: Modèles Fiables Et Conformes Aux Normes Du Secteur
Pré-Construits Pour Une Utilisation Rapide Et Efficace
Compatible MAC/PC, entièrement débloqué
Aucune Expertise N'Est Requise; Facile À Suivre
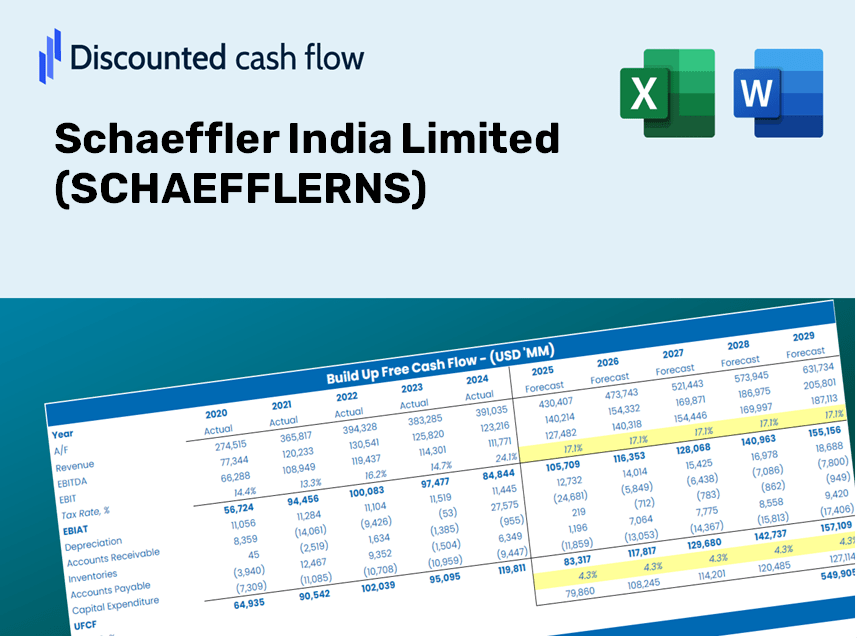
Schaeffler India Limited (SCHAEFFLER.NS) Bundle
Simplifiez l'évaluation de Schaeffler India Limited (Schaefflens) avec cette calculatrice DCF personnalisable! Doté de Real Schaeffler India Limited (Schaefflens) Financials and Rajustement des entrées de prévision, vous pouvez tester les scénarios et découvrir la juste valeur de Schaeffler India Limited (Schaefflens) en minutes.
Discounted Cash Flow (DCF) - (USD MM)
| Year | AY1 2020 |
AY2 2021 |
AY3 2022 |
AY4 2023 |
AY5 2024 |
FY1 2025 |
FY2 2026 |
FY3 2027 |
FY4 2028 |
FY5 2029 |
|---|---|---|---|---|---|---|---|---|---|---|
| Revenue | 37,618.4 | 55,605.1 | 68,674.2 | 72,509.1 | 82,323.8 | 100,936.6 | 123,757.6 | 151,738.3 | 186,045.2 | 228,108.6 |
| Revenue Growth, % | 0 | 47.81 | 23.5 | 5.58 | 13.54 | 22.61 | 22.61 | 22.61 | 22.61 | 22.61 |
| EBITDA | 5,365.9 | 9,812.6 | 12,876.2 | 13,143.5 | 14,319.8 | 17,397.8 | 21,331.3 | 26,154.2 | 32,067.4 | 39,317.6 |
| EBITDA, % | 14.26 | 17.65 | 18.75 | 18.13 | 17.39 | 17.24 | 17.24 | 17.24 | 17.24 | 17.24 |
| Depreciation | 1,849.6 | 1,882.7 | 1,963.5 | 2,118.6 | 2,681.7 | 3,500.7 | 4,292.2 | 5,262.6 | 6,452.4 | 7,911.3 |
| Depreciation, % | 4.92 | 3.39 | 2.86 | 2.92 | 3.26 | 3.47 | 3.47 | 3.47 | 3.47 | 3.47 |
| EBIT | 3,516.3 | 7,929.9 | 10,912.7 | 11,024.9 | 11,638.1 | 13,897.1 | 17,039.1 | 20,891.6 | 25,615.0 | 31,406.3 |
| EBIT, % | 9.35 | 14.26 | 15.89 | 15.2 | 14.14 | 13.77 | 13.77 | 13.77 | 13.77 | 13.77 |
| Total Cash | 11,888.0 | 13,556.0 | 15,132.7 | 15,615.7 | 13,329.1 | 23,365.5 | 28,648.2 | 35,125.4 | 43,067.0 | 52,804.1 |
| Total Cash, percent | .0 | .0 | .0 | .0 | .0 | .0 | .0 | .0 | .0 | .0 |
| Account Receivables | 7,270.1 | 8,760.5 | 10,671.1 | 10,983.9 | 13,486.2 | 16,583.8 | 20,333.3 | 24,930.5 | 30,567.1 | 37,478.1 |
| Account Receivables, % | 19.33 | 15.75 | 15.54 | 15.15 | 16.38 | 16.43 | 16.43 | 16.43 | 16.43 | 16.43 |
| Inventories | 7,382.2 | 11,061.0 | 12,656.4 | 13,433.3 | 14,696.2 | 19,041.4 | 23,346.5 | 28,625.0 | 35,096.9 | 43,032.1 |
| Inventories, % | 19.62 | 19.89 | 18.43 | 18.53 | 17.85 | 18.86 | 18.86 | 18.86 | 18.86 | 18.86 |
| Accounts Payable | 7,686.6 | 9,533.3 | 11,117.3 | 10,551.4 | 11,280.8 | 16,557.8 | 20,301.4 | 24,891.4 | 30,519.2 | 37,419.4 |
| Accounts Payable, % | 20.43 | 17.14 | 16.19 | 14.55 | 13.7 | 16.4 | 16.4 | 16.4 | 16.4 | 16.4 |
| Capital Expenditure | -2,376.9 | -1,826.3 | -4,830.4 | -5,201.0 | -7,440.2 | -6,631.0 | -8,130.2 | -9,968.4 | -12,222.2 | -14,985.5 |
| Capital Expenditure, % | -6.32 | -3.28 | -7.03 | -7.17 | -9.04 | -6.57 | -6.57 | -6.57 | -6.57 | -6.57 |
| Tax Rate, % | 26.52 | 26.52 | 26.52 | 26.52 | 26.52 | 26.52 | 26.52 | 26.52 | 26.52 | 26.52 |
| EBITAT | 2,575.8 | 5,917.0 | 8,151.4 | 8,166.0 | 8,551.4 | 10,287.0 | 12,612.8 | 15,464.4 | 18,960.8 | 23,247.8 |
| Depreciation | ||||||||||
| Changes in Account Receivables | ||||||||||
| Changes in Inventories | ||||||||||
| Changes in Accounts Payable | ||||||||||
| Capital Expenditure | ||||||||||
| UFCF | -4,917.2 | 2,650.9 | 3,362.5 | 3,428.0 | 757.1 | 4,990.9 | 4,463.8 | 5,473.0 | 6,710.4 | 8,227.6 |
| WACC, % | 4.54 | 4.54 | 4.54 | 4.54 | 4.54 | 4.54 | 4.54 | 4.54 | 4.54 | 4.54 |
| PV UFCF | ||||||||||
| SUM PV UFCF | 25,860.5 | |||||||||
| Long Term Growth Rate, % | 4.00 | |||||||||
| Free cash flow (T + 1) | 8,557 | |||||||||
| Terminal Value | 1,597,016 | |||||||||
| Present Terminal Value | 1,279,334 | |||||||||
| Enterprise Value | 1,305,195 | |||||||||
| Net Debt | -4,084 | |||||||||
| Equity Value | 1,309,279 | |||||||||
| Diluted Shares Outstanding, MM | 156 | |||||||||
| Equity Value Per Share | 8,376.49 |
Benefits You Will Receive
- Authentic SCHAEFFLERNS Financial Data: Pre-filled with Schaeffler India Limited's historical and projected figures for accurate analysis.
- Customizable Template: Easily adjust key metrics such as revenue growth, WACC, and EBITDA %.
- Instant Calculations: Observe real-time updates of Schaeffler’s intrinsic value as you make adjustments.
- Comprehensive Valuation Tool: Tailored for investors, analysts, and consultants aiming for precise DCF outcomes.
- Intuitive Interface: Designed with a clear structure and straightforward instructions suitable for all skill levels.
Key Features
- Genuine Schaeffler Financials: Gain access to reliable pre-loaded historical performance data and future forecasts.
- Tailorable Forecast Inputs: Modify the yellow-highlighted fields such as WACC, growth rates, and profit margins.
- Real-Time Calculations: Automatic updates to DCF, Net Present Value (NPV), and cash flow assessments.
- User-Friendly Dashboard: Clear charts and summaries to help you visualize your valuation findings.
- Suitable for All Skill Levels: An intuitive design catered to investors, CFOs, and consultants alike.
Understanding Our Process
- Download: Get the pre-formatted Excel spreadsheet containing Schaeffler India Limited's (SCHAEFFLERNS) financial data.
- Customize: Modify projections, such as revenue growth rates, EBITDA percentages, and WACC.
- Real-Time Updates: Watch as the intrinsic value and NPV calculations refresh automatically.
- Scenario Testing: Generate various forecasts and instantly evaluate different outcomes.
- Informed Decision-Making: Leverage the valuation insights to refine your investment approach.
Why Choose This Calculator for Schaeffler India Limited (SCHAEFFLERNS)?
- Designed for Industry Experts: An advanced tool tailored for analysts, CFOs, and consultants.
- Accurate Data: Historical and projected financials for Schaeffler India preloaded for precision.
- Flexible Scenario Analysis: Effortlessly test various forecasts and assumptions.
- Comprehensive Outputs: Automatically computes intrinsic value, NPV, and essential metrics.
- User-Friendly Interface: Step-by-step guidance ensures a smooth experience.
Who Can Benefit from Schaeffler India Limited (SCHAEFFLERNS)?
- Investors: Make informed choices with our advanced investment analysis tools.
- Financial Analysts: Enhance efficiency with our customizable DCF models designed for quick use.
- Consultants: Easily modify templates for impactful client presentations or comprehensive reports.
- Finance Enthusiasts: Expand your knowledge of valuation methodologies through practical, real-life case studies.
- Educators and Students: Utilize our resources as effective learning aids in finance-related educational programs.
What the Template Contains
- Historical Data: Includes Schaeffler India Limited's past financials and baseline forecasts.
- DCF and Levered DCF Models: Detailed templates to calculate Schaeffler India Limited's intrinsic value.
- WACC Sheet: Pre-built calculations for Weighted Average Cost of Capital.
- Editable Inputs: Modify key drivers like growth rates, EBITDA %, and CAPEX assumptions.
- Quarterly and Annual Statements: A complete breakdown of Schaeffler India Limited's financials.
- Interactive Dashboard: Visualize valuation results and projections dynamically.
Disclaimer
All information, articles, and product details provided on this website are for general informational and educational purposes only. We do not claim any ownership over, nor do we intend to infringe upon, any trademarks, copyrights, logos, brand names, or other intellectual property mentioned or depicted on this site. Such intellectual property remains the property of its respective owners, and any references here are made solely for identification or informational purposes, without implying any affiliation, endorsement, or partnership.
We make no representations or warranties, express or implied, regarding the accuracy, completeness, or suitability of any content or products presented. Nothing on this website should be construed as legal, tax, investment, financial, medical, or other professional advice. In addition, no part of this site—including articles or product references—constitutes a solicitation, recommendation, endorsement, advertisement, or offer to buy or sell any securities, franchises, or other financial instruments, particularly in jurisdictions where such activity would be unlawful.
All content is of a general nature and may not address the specific circumstances of any individual or entity. It is not a substitute for professional advice or services. Any actions you take based on the information provided here are strictly at your own risk. You accept full responsibility for any decisions or outcomes arising from your use of this website and agree to release us from any liability in connection with your use of, or reliance upon, the content or products found herein.