
|
Shoe Carnival, Inc. (SCVL) Évaluation DCF |
Entièrement Modifiable: Adapté À Vos Besoins Dans Excel Ou Sheets
Conception Professionnelle: Modèles Fiables Et Conformes Aux Normes Du Secteur
Pré-Construits Pour Une Utilisation Rapide Et Efficace
Compatible MAC/PC, entièrement débloqué
Aucune Expertise N'Est Requise; Facile À Suivre
Shoe Carnival, Inc. (SCVL) Bundle
Évaluez les perspectives financières de Shoe Carnival, Inc. (SCVL) comme un expert! Ce calculatrice DCF (SCVL) vous fournit des finances préchargées et la polyvalence pour modifier la croissance des revenus, le WACC, les marges et d'autres hypothèses critiques pour s'aligner sur vos prévisions.
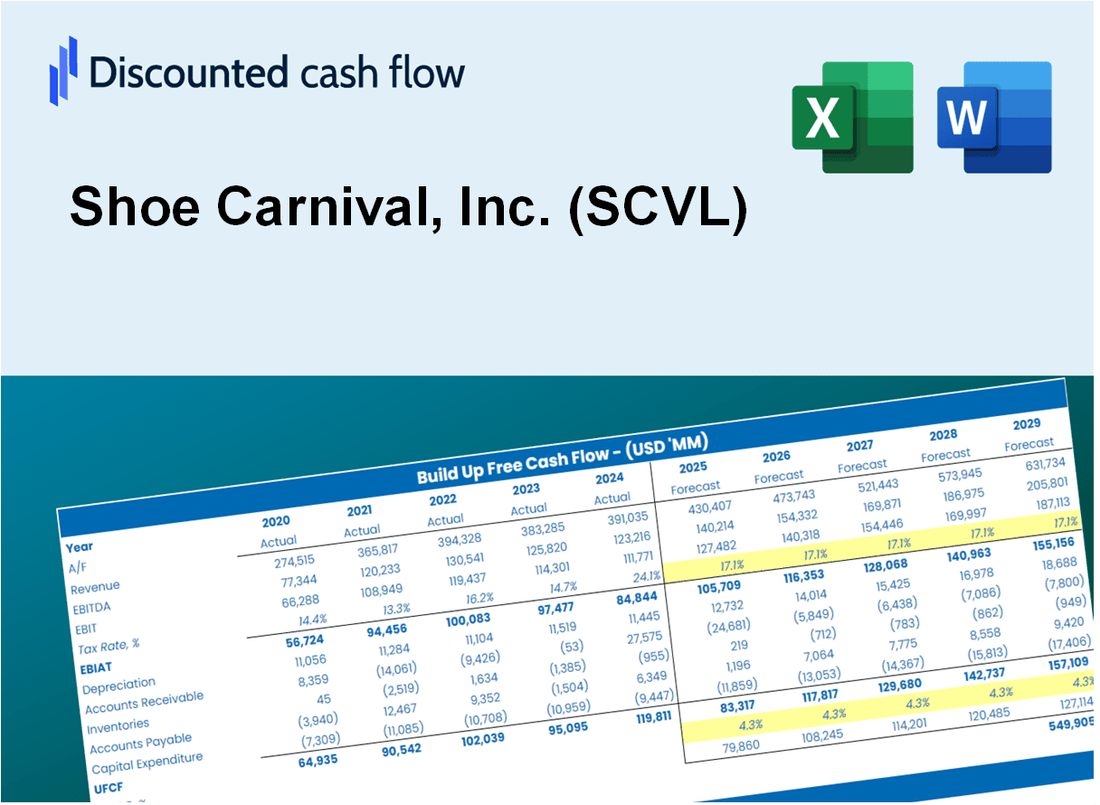
Discounted Cash Flow (DCF) - (USD MM)
| Year | AY1 2020 |
AY2 2021 |
AY3 2022 |
AY4 2023 |
AY5 2024 |
FY1 2025 |
FY2 2026 |
FY3 2027 |
FY4 2028 |
FY5 2029 |
|---|---|---|---|---|---|---|---|---|---|---|
| Revenue | 976.8 | 1,330.4 | 1,262.2 | 1,175.9 | 1,202.9 | 1,282.7 | 1,367.8 | 1,458.5 | 1,555.3 | 1,658.5 |
| Revenue Growth, % | 0 | 36.2 | -5.12 | -6.84 | 2.3 | 6.63 | 6.63 | 6.63 | 6.63 | 6.63 |
| EBITDA | 80.1 | 269.4 | 169.6 | 125.2 | 128.9 | 162.3 | 173.0 | 184.5 | 196.8 | 209.8 |
| EBITDA, % | 8.2 | 20.25 | 13.44 | 10.65 | 10.71 | 12.65 | 12.65 | 12.65 | 12.65 | 12.65 |
| Depreciation | 58.1 | 61.8 | 71.0 | 28.8 | 31.1 | 54.5 | 58.1 | 62.0 | 66.1 | 70.5 |
| Depreciation, % | 5.95 | 4.64 | 5.62 | 2.45 | 2.58 | 4.25 | 4.25 | 4.25 | 4.25 | 4.25 |
| EBIT | 22.0 | 207.7 | 98.7 | 96.4 | 97.8 | 107.8 | 114.9 | 122.5 | 130.7 | 139.3 |
| EBIT, % | 2.25 | 15.61 | 7.82 | 8.2 | 8.13 | 8.4 | 8.4 | 8.4 | 8.4 | 8.4 |
| Total Cash | 106.5 | 132.4 | 63.0 | 111.2 | 123.1 | 116.8 | 124.6 | 132.9 | 141.7 | 151.1 |
| Total Cash, percent | .0 | .0 | .0 | .0 | .0 | .0 | .0 | .0 | .0 | .0 |
| Account Receivables | 7.1 | 14.2 | 3.1 | 2.6 | 9.0 | 7.7 | 8.2 | 8.8 | 9.3 | 10.0 |
| Account Receivables, % | 0.72648 | 1.06 | 0.24179 | 0.22052 | 0.7497 | 0.60055 | 0.60055 | 0.60055 | 0.60055 | 0.60055 |
| Inventories | 233.3 | 285.2 | 390.4 | 346.4 | 385.6 | 353.4 | 376.9 | 401.9 | 428.5 | 457.0 |
| Inventories, % | 23.88 | 21.44 | 30.93 | 29.46 | 32.06 | 27.55 | 27.55 | 27.55 | 27.55 | 27.55 |
| Accounts Payable | 57.7 | 69.1 | 78.9 | 58.3 | 52.0 | 68.3 | 72.8 | 77.7 | 82.8 | 88.3 |
| Accounts Payable, % | 5.91 | 5.19 | 6.25 | 4.96 | 4.33 | 5.33 | 5.33 | 5.33 | 5.33 | 5.33 |
| Capital Expenditure | -12.4 | -31.4 | -77.3 | -56.3 | -33.2 | -44.4 | -47.3 | -50.4 | -53.8 | -57.4 |
| Capital Expenditure, % | -1.27 | -2.36 | -6.12 | -4.79 | -2.76 | -3.46 | -3.46 | -3.46 | -3.46 | -3.46 |
| Tax Rate, % | 24.33 | 24.33 | 24.33 | 24.33 | 24.33 | 24.33 | 24.33 | 24.33 | 24.33 | 24.33 |
| EBITAT | 16.3 | 155.2 | 73.8 | 73.6 | 74.0 | 81.0 | 86.4 | 92.1 | 98.2 | 104.7 |
| Depreciation | ||||||||||
| Changes in Account Receivables | ||||||||||
| Changes in Inventories | ||||||||||
| Changes in Accounts Payable | ||||||||||
| Capital Expenditure | ||||||||||
| UFCF | -120.6 | 138.0 | -16.8 | 69.9 | 20.1 | 140.9 | 77.7 | 82.9 | 88.4 | 94.3 |
| WACC, % | 6.81 | 6.82 | 6.82 | 6.84 | 6.83 | 6.82 | 6.82 | 6.82 | 6.82 | 6.82 |
| PV UFCF | ||||||||||
| SUM PV UFCF | 403.7 | |||||||||
| Long Term Growth Rate, % | 0.50 | |||||||||
| Free cash flow (T + 1) | 95 | |||||||||
| Terminal Value | 1,498 | |||||||||
| Present Terminal Value | 1,077 | |||||||||
| Enterprise Value | 1,481 | |||||||||
| Net Debt | 259 | |||||||||
| Equity Value | 1,222 | |||||||||
| Diluted Shares Outstanding, MM | 28 | |||||||||
| Equity Value Per Share | 44.38 |
What You Will Get
- Real Shoe Carnival Data: Preloaded financials – from revenue to EBIT – based on actual and projected figures.
- Full Customization: Adjust all critical parameters (yellow cells) like WACC, growth %, and tax rates.
- Instant Valuation Updates: Automatic recalculations to analyze the impact of changes on Shoe Carnival’s fair value.
- Versatile Excel Template: Tailored for quick edits, scenario testing, and detailed projections.
- Time-Saving and Accurate: Skip building models from scratch while maintaining precision and flexibility.
Key Features
- 🔍 Real-Life SCVL Financials: Pre-filled historical and projected data for Shoe Carnival, Inc.
- ✏️ Fully Customizable Inputs: Adjust all critical parameters (yellow cells) like WACC, growth %, and tax rates.
- 📊 Professional DCF Valuation: Built-in formulas calculate Shoe Carnival’s intrinsic value using the Discounted Cash Flow method.
- ⚡ Instant Results: Visualize Shoe Carnival’s valuation instantly after making changes.
- Scenario Analysis: Test and compare outcomes for various financial assumptions side-by-side.
How It Works
- Step 1: Download the prebuilt Excel template featuring Shoe Carnival, Inc. (SCVL) data.
- Step 2: Navigate through the pre-filled sheets to familiarize yourself with the key metrics.
- Step 3: Modify forecasts and assumptions within the editable yellow cells (WACC, growth, margins).
- Step 4: Instantly see recalibrated results, including Shoe Carnival, Inc. (SCVL)'s intrinsic value.
- Step 5: Utilize the outputs to make informed investment choices or create comprehensive reports.
Why Choose Shoe Carnival, Inc. (SCVL)?
- Wide Selection: Access a diverse range of footwear for the entire family, all in one place.
- Competitive Pricing: Enjoy great deals and discounts that make shopping affordable.
- Convenient Shopping Experience: Shop online or in-store with a seamless and user-friendly interface.
- Quality Assurance: Trust in our commitment to providing high-quality brands and products.
- Customer Satisfaction: Join a community of happy customers who value our exceptional service.
Who Should Use Shoe Carnival, Inc. (SCVL)?
- Shoe Shoppers: Discover a wide selection of footwear at competitive prices.
- Fashion Enthusiasts: Stay updated with the latest trends in shoes and accessories.
- Families: Find stylish and affordable options for every family member.
- Deal Seekers: Take advantage of exclusive promotions and discounts for great savings.
- Retail Analysts: Analyze market trends and consumer behavior in the footwear industry.
What the Template Contains
- Pre-Filled DCF Model: Shoe Carnival, Inc.'s (SCVL) financial data preloaded for immediate use.
- WACC Calculator: Detailed calculations for Weighted Average Cost of Capital.
- Financial Ratios: Evaluate Shoe Carnival, Inc.'s (SCVL) profitability, leverage, and efficiency.
- Editable Inputs: Change assumptions such as growth, margins, and CAPEX to fit your scenarios.
- Financial Statements: Annual and quarterly reports to support detailed analysis.
- Interactive Dashboard: Easily visualize key valuation metrics and results.
Disclaimer
All information, articles, and product details provided on this website are for general informational and educational purposes only. We do not claim any ownership over, nor do we intend to infringe upon, any trademarks, copyrights, logos, brand names, or other intellectual property mentioned or depicted on this site. Such intellectual property remains the property of its respective owners, and any references here are made solely for identification or informational purposes, without implying any affiliation, endorsement, or partnership.
We make no representations or warranties, express or implied, regarding the accuracy, completeness, or suitability of any content or products presented. Nothing on this website should be construed as legal, tax, investment, financial, medical, or other professional advice. In addition, no part of this site—including articles or product references—constitutes a solicitation, recommendation, endorsement, advertisement, or offer to buy or sell any securities, franchises, or other financial instruments, particularly in jurisdictions where such activity would be unlawful.
All content is of a general nature and may not address the specific circumstances of any individual or entity. It is not a substitute for professional advice or services. Any actions you take based on the information provided here are strictly at your own risk. You accept full responsibility for any decisions or outcomes arising from your use of this website and agree to release us from any liability in connection with your use of, or reliance upon, the content or products found herein.