
|
Senseonics Holdings, Inc. (SAGS) Évaluation DCF |
Entièrement Modifiable: Adapté À Vos Besoins Dans Excel Ou Sheets
Conception Professionnelle: Modèles Fiables Et Conformes Aux Normes Du Secteur
Pré-Construits Pour Une Utilisation Rapide Et Efficace
Compatible MAC/PC, entièrement débloqué
Aucune Expertise N'Est Requise; Facile À Suivre
Senseonics Holdings, Inc. (SENS) Bundle
Gagnez du temps et améliorez la précision avec notre calculatrice (sens) DCF! Équipée de données réelles de Senseonics Holdings, Inc. et d'hypothèses personnalisables, cet outil vous permet de prévoir, d'analyser et de valoriser Senseonics comme un investisseur chevronné.
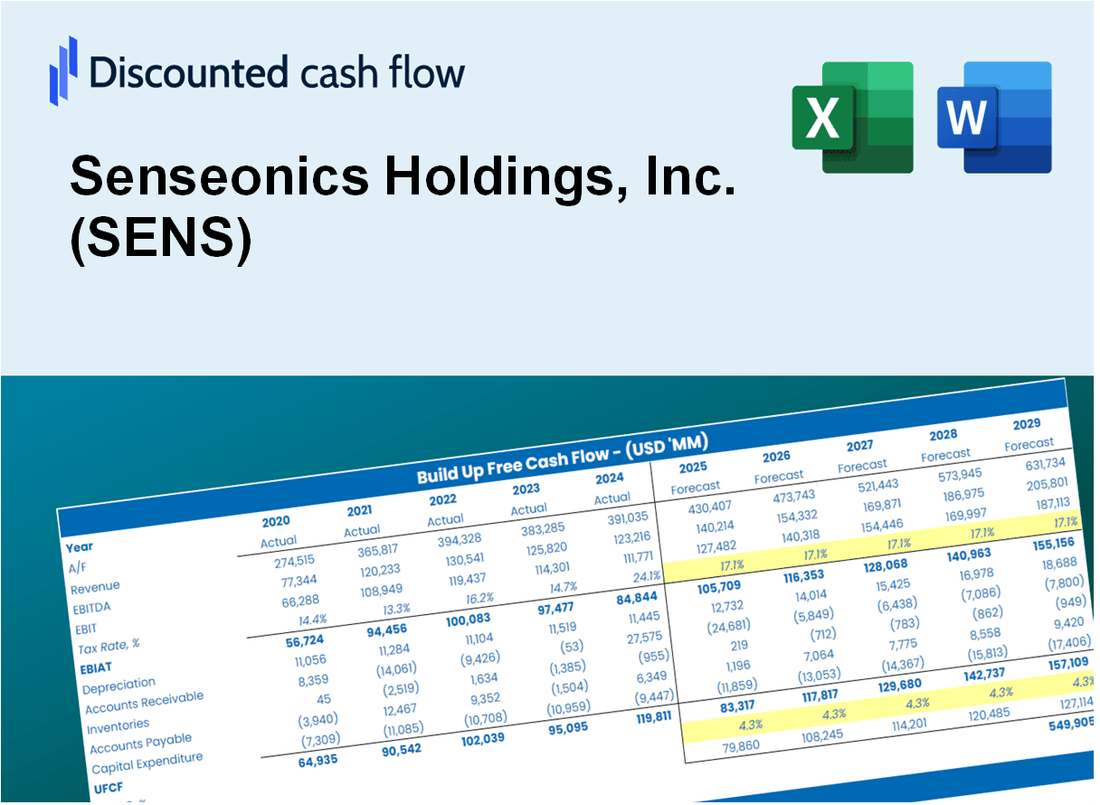
Discounted Cash Flow (DCF) - (USD MM)
| Year | AY1 2020 |
AY2 2021 |
AY3 2022 |
AY4 2023 |
AY5 2024 |
FY1 2025 |
FY2 2026 |
FY3 2027 |
FY4 2028 |
FY5 2029 |
|---|---|---|---|---|---|---|---|---|---|---|
| Revenue | 4.9 | 13.7 | 16.4 | 22.4 | 22.5 | 31.3 | 43.5 | 60.6 | 84.4 | 117.5 |
| Revenue Growth, % | 0 | 176.32 | 19.85 | 36.62 | 0.36623 | 39.21 | 39.21 | 39.21 | 39.21 | 39.21 |
| EBITDA | -157.9 | -284.5 | 161.8 | -48.0 | -68.7 | -18.8 | -26.1 | -36.4 | -50.6 | -70.5 |
| EBITDA, % | -3189.74 | -2080.55 | 987.29 | -214.4 | -305.73 | -60 | -60 | -60 | -60 | -60 |
| Depreciation | 1.1 | 1.2 | 1.0 | 1.3 | 1.5 | 3.2 | 4.4 | 6.1 | 8.5 | 11.8 |
| Depreciation, % | 23.06 | 9.06 | 6.01 | 5.7 | 6.56 | 10.08 | 10.08 | 10.08 | 10.08 | 10.08 |
| EBIT | -159.0 | -285.8 | 160.8 | -49.3 | -70.2 | -18.8 | -26.1 | -36.4 | -50.6 | -70.5 |
| EBIT, % | -3212.79 | -2089.61 | 981.28 | -220.11 | -312.3 | -60 | -60 | -60 | -60 | -60 |
| Total Cash | 18.0 | 129.9 | 144.0 | 109.5 | 74.6 | 31.3 | 43.5 | 60.6 | 84.4 | 117.5 |
| Total Cash, percent | .0 | .0 | .0 | .0 | .0 | .0 | .0 | .0 | .0 | .0 |
| Account Receivables | 3.0 | 2.4 | 2.8 | 6.6 | 8.1 | 10.0 | 14.0 | 19.5 | 27.1 | 37.7 |
| Account Receivables, % | 60.34 | 17.67 | 17.01 | 29.46 | 35.95 | 32.08 | 32.08 | 32.08 | 32.08 | 32.08 |
| Inventories | 5.3 | 6.3 | 7.3 | 8.8 | 4.4 | 15.6 | 21.7 | 30.3 | 42.1 | 58.7 |
| Inventories, % | 106.71 | 46.19 | 44.58 | 39.2 | 19.67 | 49.93 | 49.93 | 49.93 | 49.93 | 49.93 |
| Accounts Payable | 1.8 | 1.2 | .4 | 4.6 | 3.2 | 5.1 | 7.1 | 9.9 | 13.8 | 19.2 |
| Accounts Payable, % | 35.6 | 8.8 | 2.56 | 20.4 | 14.26 | 16.33 | 16.33 | 16.33 | 16.33 | 16.33 |
| Capital Expenditure | -.2 | -.2 | -.3 | -.4 | -2.2 | -1.2 | -1.6 | -2.3 | -3.1 | -4.4 |
| Capital Expenditure, % | -3.66 | -1.54 | -1.9 | -1.56 | -9.96 | -3.72 | -3.72 | -3.72 | -3.72 | -3.72 |
| Tax Rate, % | 0 | 0 | 0 | 0 | 0 | 0 | 0 | 0 | 0 | 0 |
| EBITAT | -159.0 | -285.8 | 160.8 | -49.3 | -70.2 | -18.8 | -26.1 | -36.4 | -50.6 | -70.5 |
| Depreciation | ||||||||||
| Changes in Account Receivables | ||||||||||
| Changes in Inventories | ||||||||||
| Changes in Accounts Payable | ||||||||||
| Capital Expenditure | ||||||||||
| UFCF | -164.5 | -285.7 | 159.3 | -49.5 | -69.4 | -28.0 | -31.4 | -43.7 | -60.9 | -84.8 |
| WACC, % | 9.42 | 9.42 | 9.42 | 9.42 | 9.42 | 9.42 | 9.42 | 9.42 | 9.42 | 9.42 |
| PV UFCF | ||||||||||
| SUM PV UFCF | -181.8 | |||||||||
| Long Term Growth Rate, % | 2.00 | |||||||||
| Free cash flow (T + 1) | -86 | |||||||||
| Terminal Value | -1,165 | |||||||||
| Present Terminal Value | -743 | |||||||||
| Enterprise Value | -925 | |||||||||
| Net Debt | -14 | |||||||||
| Equity Value | -911 | |||||||||
| Diluted Shares Outstanding, MM | 31 | |||||||||
| Equity Value Per Share | -28.95 |
What You Will Receive
- Comprehensive Financial Model: Senseonics' actual data facilitates accurate DCF valuation.
- Complete Forecast Control: Modify revenue growth, profit margins, discount rates, and other critical factors.
- Real-Time Calculations: Automatic updates provide immediate feedback as you adjust inputs.
- Professional-Grade Template: A polished Excel file crafted for high-quality valuation analysis.
- Flexible and Reusable: Designed for adaptability, allowing for repeated use in detailed projections.
Key Features
- Comprehensive Financial Data: Gain access to precise pre-loaded historical figures and future forecasts for Senseonics Holdings, Inc. (SENS).
- Adjustable Forecast Parameters: Modify yellow-highlighted fields such as WACC, growth rates, and profit margins.
- Real-time Calculations: Automatic updates for DCF, Net Present Value (NPV), and cash flow assessments.
- User-Friendly Dashboard: Intuitive charts and summaries to help visualize your valuation outcomes.
- Designed for All Levels: A straightforward, user-friendly layout tailored for investors, CFOs, and consultants alike.
How It Works
- Download the Template: Gain immediate access to the Excel-based SENS DCF Calculator.
- Input Your Assumptions: Modify the yellow-highlighted cells for growth rates, WACC, margins, and more.
- Instant Calculations: The model automatically recalculates Senseonics’ intrinsic value.
- Test Scenarios: Experiment with various assumptions to assess potential valuation shifts.
- Analyze and Decide: Utilize the findings to inform your investment or financial analysis.
Why Choose This Calculator for Senseonics Holdings, Inc. (SENS)?
- Accuracy: Utilizes real financial data from Senseonics for precise calculations.
- Flexibility: Allows users to easily adjust and experiment with various inputs.
- Time-Saving: Eliminate the need to create a DCF model from the ground up.
- Professional-Grade: Crafted with the expertise and standards expected by CFOs.
- User-Friendly: Intuitive interface suitable for users of all financial backgrounds.
Who Should Use This Product?
- Investors: Evaluate Senseonics Holdings, Inc. (SENS) for informed buying or selling decisions.
- CFOs and Financial Analysts: Optimize valuation methodologies and assess future projections.
- Startup Founders: Discover the valuation strategies employed by publicly traded companies like Senseonics.
- Consultants: Create detailed valuation reports for clients focusing on Senseonics Holdings, Inc. (SENS).
- Students and Educators: Utilize current market data to practice and teach valuation principles.
What the Template Contains
- Pre-Filled DCF Model: Senseonics Holdings, Inc.'s (SENS) financial data preloaded for immediate use.
- WACC Calculator: Detailed calculations for Weighted Average Cost of Capital tailored for (SENS).
- Financial Ratios: Evaluate Senseonics' (SENS) profitability, leverage, and efficiency metrics.
- Editable Inputs: Modify assumptions such as growth rates, margins, and CAPEX to suit your analysis.
- Financial Statements: Access annual and quarterly reports to facilitate comprehensive analysis.
- Interactive Dashboard: Visualize key valuation metrics and results for (SENS) with ease.
Disclaimer
All information, articles, and product details provided on this website are for general informational and educational purposes only. We do not claim any ownership over, nor do we intend to infringe upon, any trademarks, copyrights, logos, brand names, or other intellectual property mentioned or depicted on this site. Such intellectual property remains the property of its respective owners, and any references here are made solely for identification or informational purposes, without implying any affiliation, endorsement, or partnership.
We make no representations or warranties, express or implied, regarding the accuracy, completeness, or suitability of any content or products presented. Nothing on this website should be construed as legal, tax, investment, financial, medical, or other professional advice. In addition, no part of this site—including articles or product references—constitutes a solicitation, recommendation, endorsement, advertisement, or offer to buy or sell any securities, franchises, or other financial instruments, particularly in jurisdictions where such activity would be unlawful.
All content is of a general nature and may not address the specific circumstances of any individual or entity. It is not a substitute for professional advice or services. Any actions you take based on the information provided here are strictly at your own risk. You accept full responsibility for any decisions or outcomes arising from your use of this website and agree to release us from any liability in connection with your use of, or reliance upon, the content or products found herein.