
|
Stitch Fix, Inc. (SFIX) Évaluation DCF |
Entièrement Modifiable: Adapté À Vos Besoins Dans Excel Ou Sheets
Conception Professionnelle: Modèles Fiables Et Conformes Aux Normes Du Secteur
Pré-Construits Pour Une Utilisation Rapide Et Efficace
Compatible MAC/PC, entièrement débloqué
Aucune Expertise N'Est Requise; Facile À Suivre
Stitch Fix, Inc. (SFIX) Bundle
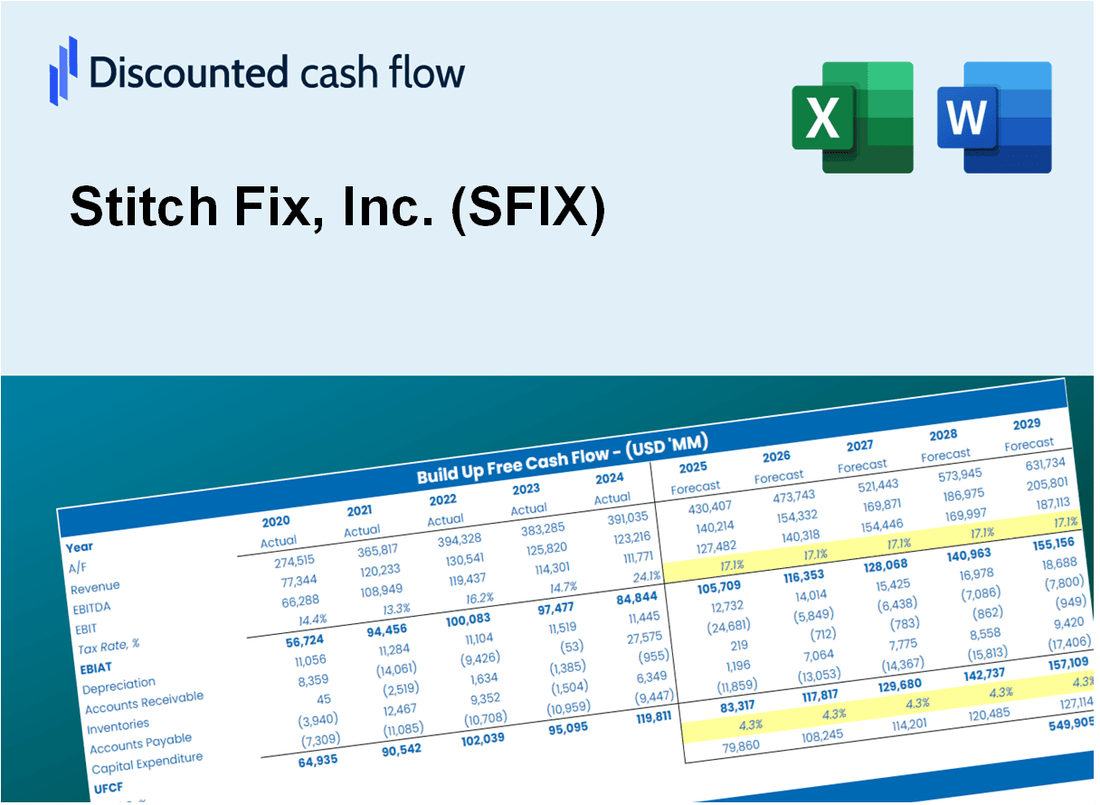
Que vous soyez un investisseur ou un analyste, cette calculatrice DCF Stitch Fix, Inc. (SFIX) est votre ressource incontournable pour une évaluation précise. Préchargé avec des données réelles de la correction de Stitch, vous pouvez ajuster les prévisions et observer immédiatement les effets.
What You Will Get
- Real SFIX Financials: Access to historical and projected data for precise valuation.
- Customizable Inputs: Adjust metrics like WACC, tax rates, revenue growth, and capital expenditures.
- Dynamic Calculations: Intrinsic value and NPV are computed in real-time.
- Scenario Analysis: Explore various scenarios to assess Stitch Fix’s future performance.
- User-Friendly Design: Crafted for professionals while remaining approachable for newcomers.
Key Features
- Real-Life SFIX Data: Pre-filled with Stitch Fix’s historical financials and forward-looking projections.
- Fully Customizable Inputs: Adjust revenue growth, margins, WACC, tax rates, and capital expenditures.
- Dynamic Valuation Model: Automatic updates to Net Present Value (NPV) and intrinsic value based on your inputs.
- Scenario Testing: Create multiple forecast scenarios to analyze different valuation outcomes.
- User-Friendly Design: Simple, structured, and designed for professionals and beginners alike.
How It Works
- 1. Access the Model: Download and open the Excel file featuring Stitch Fix, Inc.'s (SFIX) preloaded data.
- 2. Adjust Key Inputs: Modify crucial parameters such as growth rates, WACC, and capital expenditures.
- 3. Analyze Results in Real-Time: The DCF model automatically computes intrinsic value and NPV.
- 4. Explore Different Scenarios: Evaluate various forecasts to assess different valuation possibilities.
- 5. Make Informed Decisions: Present expert valuation insights to enhance your decision-making process.
Why Choose Stitch Fix, Inc. (SFIX)?
- Personalized Experience: Tailored clothing selections based on your unique style and preferences.
- Expert Stylists: Professional stylists curate outfits that enhance your wardrobe.
- Convenient Shopping: Enjoy the ease of trying on clothes at home before making a purchase.
- Flexible Subscription: Choose how often you receive your personalized boxes – it's all up to you.
- Quality Assurance: High-quality brands and pieces that meet your fashion standards.
Who Should Use This Product?
- Individual Investors: Make informed decisions about buying or selling Stitch Fix stock (SFIX).
- Financial Analysts: Enhance valuation processes with comprehensive financial models tailored for Stitch Fix (SFIX).
- Consultants: Provide clients with expert valuation insights on Stitch Fix (SFIX) efficiently and accurately.
- Business Owners: Gain insights into how companies like Stitch Fix (SFIX) are valued to inform your own business strategy.
- Finance Students: Explore valuation techniques using real-world data and scenarios related to Stitch Fix (SFIX).
What the Template Contains
- Preloaded SFIX Data: Historical and projected financial data, including revenue, EBIT, and capital expenditures.
- DCF and WACC Models: Professional-grade sheets for calculating intrinsic value and Weighted Average Cost of Capital.
- Editable Inputs: Yellow-highlighted cells for adjusting revenue growth, tax rates, and discount rates.
- Financial Statements: Comprehensive annual and quarterly financials for deeper analysis.
- Key Ratios: Profitability, leverage, and efficiency ratios to evaluate performance.
- Dashboard and Charts: Visual summaries of valuation outcomes and assumptions.
Disclaimer
All information, articles, and product details provided on this website are for general informational and educational purposes only. We do not claim any ownership over, nor do we intend to infringe upon, any trademarks, copyrights, logos, brand names, or other intellectual property mentioned or depicted on this site. Such intellectual property remains the property of its respective owners, and any references here are made solely for identification or informational purposes, without implying any affiliation, endorsement, or partnership.
We make no representations or warranties, express or implied, regarding the accuracy, completeness, or suitability of any content or products presented. Nothing on this website should be construed as legal, tax, investment, financial, medical, or other professional advice. In addition, no part of this site—including articles or product references—constitutes a solicitation, recommendation, endorsement, advertisement, or offer to buy or sell any securities, franchises, or other financial instruments, particularly in jurisdictions where such activity would be unlawful.
All content is of a general nature and may not address the specific circumstances of any individual or entity. It is not a substitute for professional advice or services. Any actions you take based on the information provided here are strictly at your own risk. You accept full responsibility for any decisions or outcomes arising from your use of this website and agree to release us from any liability in connection with your use of, or reliance upon, the content or products found herein.