
|
Steven Madden, Ltd. (Shoo) Valation DCF |
Entièrement Modifiable: Adapté À Vos Besoins Dans Excel Ou Sheets
Conception Professionnelle: Modèles Fiables Et Conformes Aux Normes Du Secteur
Pré-Construits Pour Une Utilisation Rapide Et Efficace
Compatible MAC/PC, entièrement débloqué
Aucune Expertise N'Est Requise; Facile À Suivre
Steven Madden, Ltd. (SHOO) Bundle
Prenez en charge votre analyse d'évaluation de Steven Madden, Ltd. (Shoo) avec notre calculatrice DCF de pointe! Préchargé avec des données réelles (shoo), ce modèle Excel vous permet d'ajuster les prévisions et les hypothèses pour déterminer avec précision la valeur intrinsèque de Steven Madden, Ltd. (Shoo).
What You Will Get
- Real SHOO Financials: Access to historical and projected data for precise valuation.
- Customizable Inputs: Adjust WACC, tax rates, revenue growth, and capital expenditures as needed.
- Dynamic Calculations: Intrinsic value and NPV are computed in real-time.
- Scenario Analysis: Evaluate various scenarios to assess Steven Madden's future performance.
- User-Friendly Design: Designed for professionals while remaining approachable for newcomers.
Key Features
- Customizable Financial Inputs: Adjust essential metrics such as sales growth, operating margin, and capital investments.
- Instant DCF Valuation: Quickly computes intrinsic value, NPV, and additional financial metrics.
- High-Precision Accuracy: Leverages Steven Madden's actual financial data for precise valuation results.
- Effortless Scenario Analysis: Easily evaluate various assumptions and assess different outcomes.
- Efficiency Booster: Avoid the hassle of constructing intricate valuation models from the ground up.
How It Works
- Step 1: Download the Excel file.
- Step 2: Review Steven Madden’s pre-filled financial data and forecasts.
- Step 3: Modify critical inputs like revenue growth, WACC, and tax rates (highlighted cells).
- Step 4: Watch the DCF model update instantly as you tweak assumptions.
- Step 5: Analyze the outputs and use the results for investment decisions.
Why Choose This Calculator for Steven Madden, Ltd. (SHOO)?
- User-Friendly Interface: Perfect for both novices and seasoned professionals.
- Customizable Inputs: Adjust parameters easily to suit your financial analysis.
- Real-Time Valuation: Observe immediate updates to Steven Madden’s valuation as you change inputs.
- Preloaded Data: Comes with Steven Madden’s latest financial figures for swift evaluations.
- Relied Upon by Experts: Favored by analysts and investors for making strategic choices.
Who Should Use This Product?
- Investors: Evaluate Steven Madden’s valuation before making stock decisions.
- CFOs and Financial Analysts: Enhance valuation workflows and assess financial forecasts.
- Startup Founders: Discover how established brands like Steven Madden are appraised.
- Consultants: Provide comprehensive valuation reports for your clients.
- Students and Educators: Utilize real market data to learn and teach valuation methodologies.
What the Template Contains
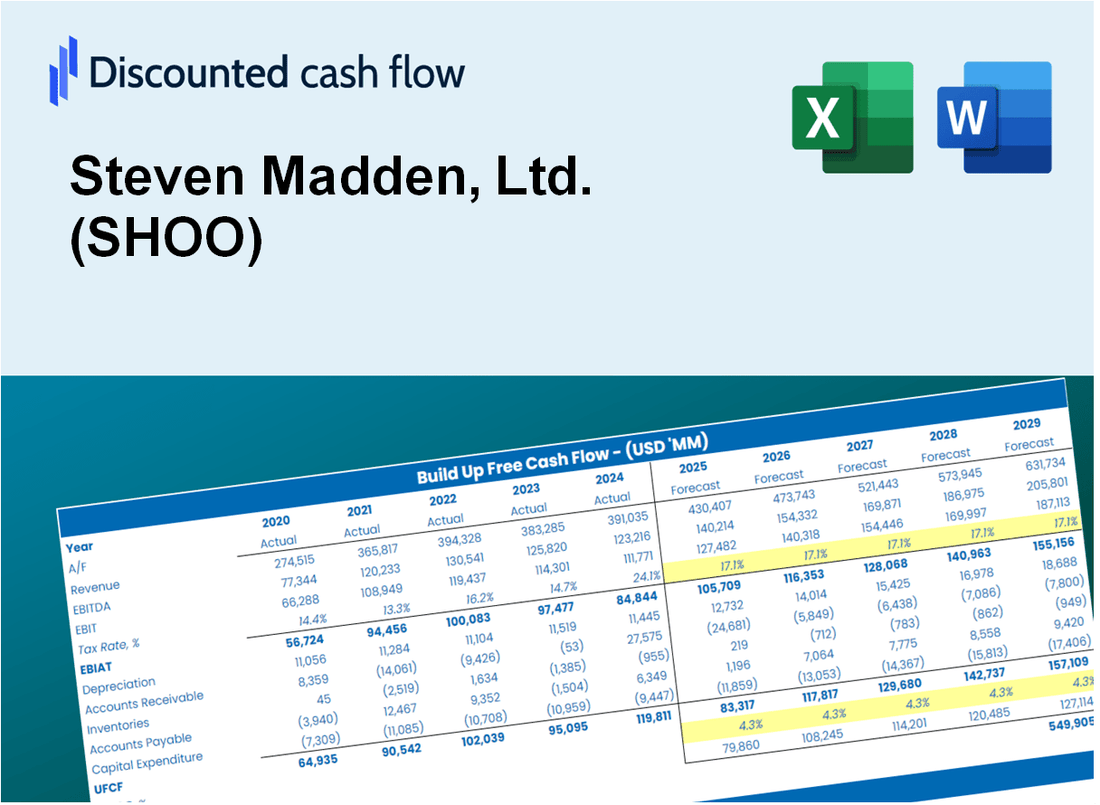
- Operating and Balance Sheet Data: Pre-filled Steven Madden historical data and forecasts, including revenue, EBITDA, EBIT, and capital expenditures.
- WACC Calculation: A dedicated sheet for Weighted Average Cost of Capital (WACC), including parameters like Beta, risk-free rate, and share price.
- DCF Valuation (Unlevered and Levered): Editable Discounted Cash Flow models showing intrinsic value with detailed calculations.
- Financial Statements: Pre-loaded financial statements (annual and quarterly) to support analysis.
- Key Ratios: Includes profitability, leverage, and efficiency ratios for Steven Madden, Ltd. (SHOO).
- Dashboard and Charts: Visual summary of valuation outputs and assumptions to analyze results easily.
Disclaimer
All information, articles, and product details provided on this website are for general informational and educational purposes only. We do not claim any ownership over, nor do we intend to infringe upon, any trademarks, copyrights, logos, brand names, or other intellectual property mentioned or depicted on this site. Such intellectual property remains the property of its respective owners, and any references here are made solely for identification or informational purposes, without implying any affiliation, endorsement, or partnership.
We make no representations or warranties, express or implied, regarding the accuracy, completeness, or suitability of any content or products presented. Nothing on this website should be construed as legal, tax, investment, financial, medical, or other professional advice. In addition, no part of this site—including articles or product references—constitutes a solicitation, recommendation, endorsement, advertisement, or offer to buy or sell any securities, franchises, or other financial instruments, particularly in jurisdictions where such activity would be unlawful.
All content is of a general nature and may not address the specific circumstances of any individual or entity. It is not a substitute for professional advice or services. Any actions you take based on the information provided here are strictly at your own risk. You accept full responsibility for any decisions or outcomes arising from your use of this website and agree to release us from any liability in connection with your use of, or reliance upon, the content or products found herein.