
|
Sotherly Hotels Inc. (SOHO) Évaluation DCF |
Entièrement Modifiable: Adapté À Vos Besoins Dans Excel Ou Sheets
Conception Professionnelle: Modèles Fiables Et Conformes Aux Normes Du Secteur
Pré-Construits Pour Une Utilisation Rapide Et Efficace
Compatible MAC/PC, entièrement débloqué
Aucune Expertise N'Est Requise; Facile À Suivre
Sotherly Hotels Inc. (SOHO) Bundle
Découvrez la vraie valeur de Sotherly Hotels Inc. (SOHO) avec notre calculatrice avancée DCF! Ajustez les hypothèses clés, explorez divers scénarios et évaluez les effets des modifications sur Sotherly Hotels Inc. (SOHO) Valation - le tout dans un seul modèle Excel.
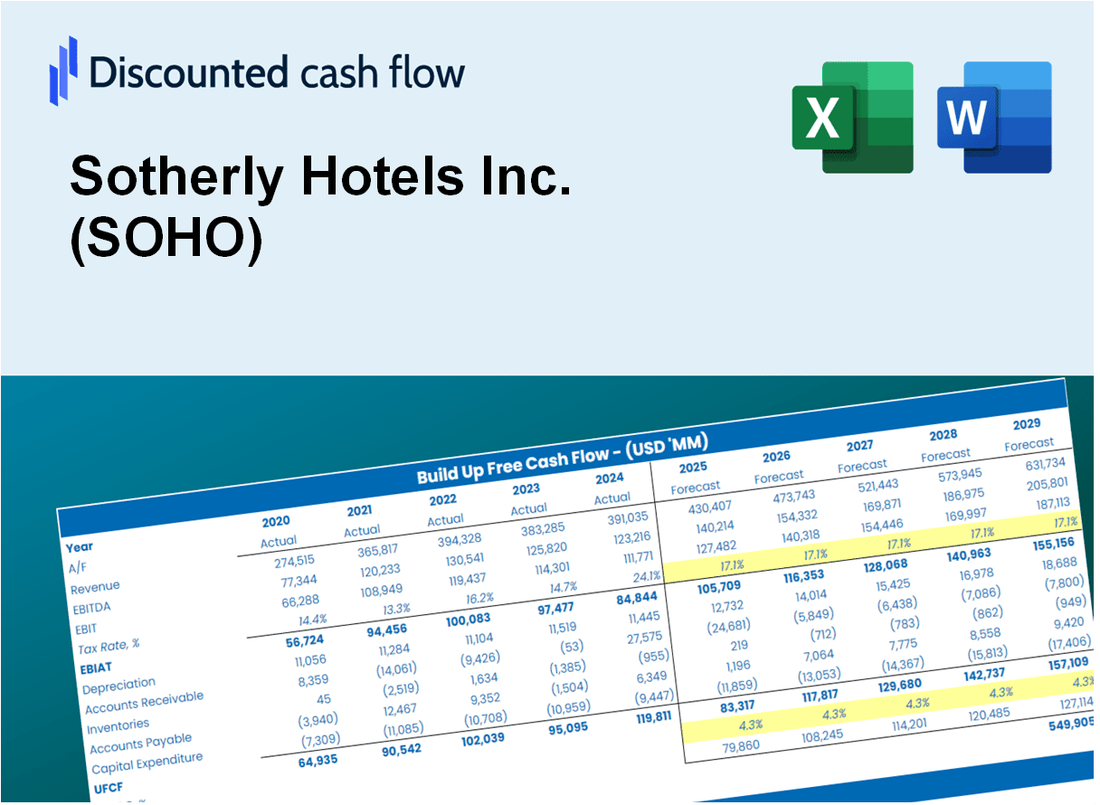
Discounted Cash Flow (DCF) - (USD MM)
| Year | AY1 2020 |
AY2 2021 |
AY3 2022 |
AY4 2023 |
AY5 2024 |
FY1 2025 |
FY2 2026 |
FY3 2027 |
FY4 2028 |
FY5 2029 |
|---|---|---|---|---|---|---|---|---|---|---|
| Revenue | 71.5 | 127.6 | 166.1 | 173.8 | 181.9 | 178.7 | 175.5 | 172.3 | 169.3 | 166.3 |
| Revenue Growth, % | 0 | 78.44 | 30.17 | 4.67 | 4.63 | -1.78 | -1.78 | -1.78 | -1.78 | -1.78 |
| EBITDA | -10.7 | 14.1 | 72.9 | 39.9 | 41.6 | 30.6 | 30.1 | 29.6 | 29.0 | 28.5 |
| EBITDA, % | -14.97 | 11.04 | 43.9 | 22.94 | 22.86 | 17.15 | 17.15 | 17.15 | 17.15 | 17.15 |
| Depreciation | 19.9 | 19.9 | 18.7 | 18.8 | 19.4 | 27.2 | 26.7 | 26.2 | 25.8 | 25.3 |
| Depreciation, % | 27.83 | 15.6 | 11.23 | 10.81 | 10.66 | 15.22 | 15.22 | 15.22 | 15.22 | 15.22 |
| EBIT | -30.6 | -5.8 | 54.3 | 21.1 | 22.2 | 3.4 | 3.4 | 3.3 | 3.3 | 3.2 |
| EBIT, % | -42.8 | -4.57 | 32.67 | 12.13 | 12.2 | 1.93 | 1.93 | 1.93 | 1.93 | 1.93 |
| Total Cash | 25.3 | 13.2 | 21.9 | 17.1 | 7.3 | 26.0 | 25.5 | 25.1 | 24.6 | 24.2 |
| Total Cash, percent | .0 | .0 | .0 | .0 | .0 | .0 | .0 | .0 | .0 | .0 |
| Account Receivables | 2.2 | 4.8 | 5.8 | 5.9 | 7.5 | 6.4 | 6.3 | 6.2 | 6.1 | 6.0 |
| Account Receivables, % | 3.05 | 3.78 | 3.52 | 3.42 | 4.14 | 3.58 | 3.58 | 3.58 | 3.58 | 3.58 |
| Inventories | .0 | 35.3 | 8.3 | 6.3 | 5.8 | 14.1 | 13.9 | 13.6 | 13.4 | 13.1 |
| Inventories, % | 0 | 27.66 | 5 | 3.65 | 3.17 | 7.9 | 7.9 | 7.9 | 7.9 | 7.9 |
| Accounts Payable | 35.6 | 36.0 | 25.7 | 23.3 | 26.6 | 43.4 | 42.6 | 41.9 | 41.1 | 40.4 |
| Accounts Payable, % | 49.83 | 28.18 | 15.48 | 13.41 | 14.61 | 24.3 | 24.3 | 24.3 | 24.3 | 24.3 |
| Capital Expenditure | -4.0 | -3.2 | -8.0 | -8.2 | -14.6 | -9.2 | -9.0 | -8.8 | -8.7 | -8.5 |
| Capital Expenditure, % | -5.62 | -2.49 | -4.8 | -4.71 | -8.05 | -5.13 | -5.13 | -5.13 | -5.13 | -5.13 |
| Tax Rate, % | 0.76017 | 0.76017 | 0.76017 | 0.76017 | 0.76017 | 0.76017 | 0.76017 | 0.76017 | 0.76017 | 0.76017 |
| EBITAT | -31.1 | -5.4 | 51.2 | 23.7 | 22.0 | 3.3 | 3.3 | 3.2 | 3.2 | 3.1 |
| Depreciation | ||||||||||
| Changes in Account Receivables | ||||||||||
| Changes in Inventories | ||||||||||
| Changes in Accounts Payable | ||||||||||
| Capital Expenditure | ||||||||||
| UFCF | 18.2 | -26.2 | 77.6 | 33.8 | 29.0 | 31.0 | 20.6 | 20.2 | 19.9 | 19.5 |
| WACC, % | 6.24 | 5.81 | 5.94 | 6.24 | 6.2 | 6.09 | 6.09 | 6.09 | 6.09 | 6.09 |
| PV UFCF | ||||||||||
| SUM PV UFCF | 94.7 | |||||||||
| Long Term Growth Rate, % | 0.50 | |||||||||
| Free cash flow (T + 1) | 20 | |||||||||
| Terminal Value | 351 | |||||||||
| Present Terminal Value | 261 | |||||||||
| Enterprise Value | 356 | |||||||||
| Net Debt | 333 | |||||||||
| Equity Value | 23 | |||||||||
| Diluted Shares Outstanding, MM | 19 | |||||||||
| Equity Value Per Share | 1.17 |
What You Will Get
- Real Sotherly Hotels Data: Preloaded financials – from revenue to EBIT – based on actual and projected figures.
- Full Customization: Adjust all critical parameters (yellow cells) like WACC, growth %, and tax rates.
- Instant Valuation Updates: Automatic recalculations to analyze the impact of changes on Sotherly Hotels’ fair value.
- Versatile Excel Template: Tailored for quick edits, scenario testing, and detailed projections.
- Time-Saving and Accurate: Skip building models from scratch while maintaining precision and flexibility.
Key Features
- Comprehensive SOHO Data: Pre-loaded with Sotherly Hotels Inc.'s historical performance metrics and future growth forecasts.
- Customizable Financial Inputs: Tailor revenue projections, operating margins, discount rates, tax implications, and capital investments.
- Adaptive Valuation Framework: Real-time adjustments to Net Present Value (NPV) and intrinsic value based on user-defined parameters.
- Scenario Analysis: Develop various forecasting scenarios to evaluate different valuation possibilities.
- Intuitive User Interface: Designed for ease of use, catering to both industry experts and newcomers.
How It Works
- Step 1: Download the Excel file.
- Step 2: Review pre-entered Sotherly Hotels Inc. (SOHO) data (historical and projected).
- Step 3: Adjust key assumptions (yellow cells) based on your analysis.
- Step 4: View automatic recalculations for Sotherly Hotels Inc.'s (SOHO) intrinsic value.
- Step 5: Use the outputs for investment decisions or reporting.
Why Choose Sotherly Hotels Inc. (SOHO)?
- Save Time: No need to start from scratch – our resources are readily available.
- Enhance Accuracy: Dependable financial insights and metrics minimize valuation errors.
- Fully Customizable: Adapt our tools to match your specific assumptions and forecasts.
- Easy to Understand: Intuitive charts and outputs facilitate straightforward analysis of results.
- Endorsed by Professionals: Crafted for experts who prioritize precision and functionality.
Who Should Use This Product?
- Investors: Evaluate Sotherly Hotels Inc.’s (SOHO) performance before making investment decisions.
- CFOs and Financial Analysts: Optimize valuation methodologies and assess future earnings potential.
- Hotel Operators and Managers: Understand how hospitality companies like Sotherly Hotels Inc. (SOHO) are valued in the market.
- Consultants: Create detailed valuation assessments for clients in the hospitality sector.
- Students and Educators: Analyze real-time data to enhance learning about hotel industry valuations.
What the Template Contains
- Pre-Filled Data: Contains Sotherly Hotels Inc.'s historical financials and projections.
- Discounted Cash Flow Model: An editable DCF valuation model with automated calculations.
- Weighted Average Cost of Capital (WACC): A dedicated sheet for WACC calculation based on user-defined inputs.
- Key Financial Ratios: Evaluate Sotherly Hotels Inc.'s profitability, efficiency, and leverage.
- Customizable Inputs: Easily modify revenue growth, margins, and tax rates.
- Clear Dashboard: Visual representations and tables summarizing essential valuation outcomes.
Disclaimer
All information, articles, and product details provided on this website are for general informational and educational purposes only. We do not claim any ownership over, nor do we intend to infringe upon, any trademarks, copyrights, logos, brand names, or other intellectual property mentioned or depicted on this site. Such intellectual property remains the property of its respective owners, and any references here are made solely for identification or informational purposes, without implying any affiliation, endorsement, or partnership.
We make no representations or warranties, express or implied, regarding the accuracy, completeness, or suitability of any content or products presented. Nothing on this website should be construed as legal, tax, investment, financial, medical, or other professional advice. In addition, no part of this site—including articles or product references—constitutes a solicitation, recommendation, endorsement, advertisement, or offer to buy or sell any securities, franchises, or other financial instruments, particularly in jurisdictions where such activity would be unlawful.
All content is of a general nature and may not address the specific circumstances of any individual or entity. It is not a substitute for professional advice or services. Any actions you take based on the information provided here are strictly at your own risk. You accept full responsibility for any decisions or outcomes arising from your use of this website and agree to release us from any liability in connection with your use of, or reliance upon, the content or products found herein.