
|
Tata Motors Limited (Tatamotors.NS) Évaluation DCF |
Entièrement Modifiable: Adapté À Vos Besoins Dans Excel Ou Sheets
Conception Professionnelle: Modèles Fiables Et Conformes Aux Normes Du Secteur
Pré-Construits Pour Une Utilisation Rapide Et Efficace
Compatible MAC/PC, entièrement débloqué
Aucune Expertise N'Est Requise; Facile À Suivre
Tata Motors Limited (TATAMOTORS.NS) Bundle
Explorez l'avenir financier de Tata Motors Limited (Tatamotorsns) avec notre calculatrice DCF conviviale! Entrez vos projections pour la croissance, les marges et les dépenses pour calculer la valeur intrinsèque de Tata Motors Limited (Tatamotorsns) et façonnez votre approche d'investissement.
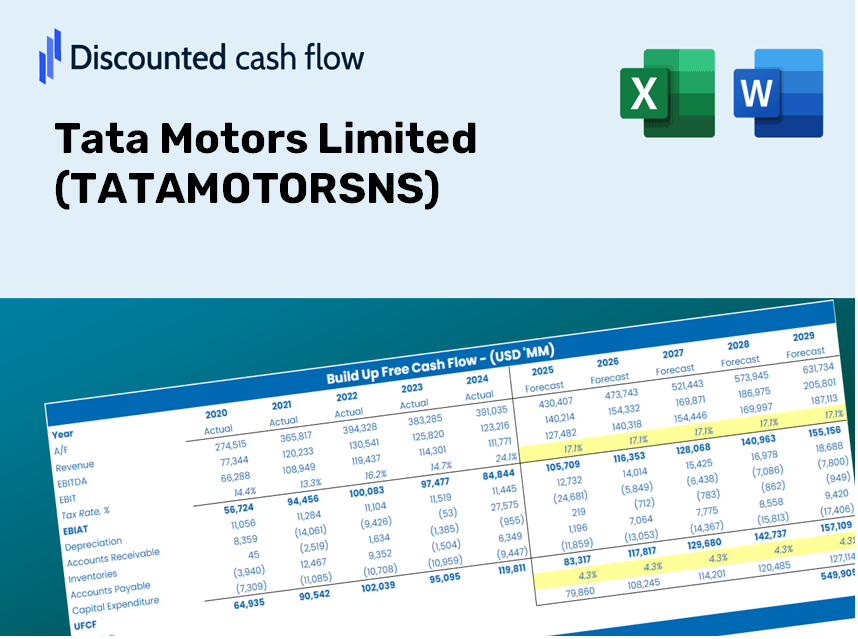
Discounted Cash Flow (DCF) - (USD MM)
| Year | AY1 2021 |
AY2 2022 |
AY3 2023 |
AY4 2024 |
AY5 2025 |
FY1 2026 |
FY2 2027 |
FY3 2028 |
FY4 2029 |
FY5 2030 |
|---|---|---|---|---|---|---|---|---|---|---|
| Revenue | 2,497,947.5 | 2,784,536.2 | 3,459,669.7 | 4,340,160.0 | 4,396,950.0 | 5,083,724.9 | 5,877,769.4 | 6,795,838.6 | 7,857,304.2 | 9,084,563.8 |
| Revenue Growth, % | 0 | 11.47 | 24.25 | 25.45 | 1.31 | 15.62 | 15.62 | 15.62 | 15.62 | 15.62 |
| EBITDA | 198,759.9 | 132,671.4 | 217,592.4 | 468,250.0 | 466,390.0 | 410,834.1 | 475,003.7 | 549,196.2 | 634,977.1 | 734,156.4 |
| EBITDA, % | 7.96 | 4.76 | 6.29 | 10.79 | 10.61 | 8.08 | 8.08 | 8.08 | 8.08 | 8.08 |
| Depreciation | 109,492.8 | 111,649.0 | 118,766.9 | 132,210.0 | 113,050.0 | 177,352.0 | 205,053.2 | 237,081.2 | 274,111.8 | 316,926.2 |
| Depreciation, % | 4.38 | 4.01 | 3.43 | 3.05 | 2.57 | 3.49 | 3.49 | 3.49 | 3.49 | 3.49 |
| EBIT | 89,267.1 | 21,022.4 | 98,825.5 | 336,040.0 | 353,340.0 | 233,482.1 | 269,950.5 | 312,115.0 | 360,865.3 | 417,230.1 |
| EBIT, % | 3.57 | 0.75497 | 2.86 | 7.74 | 8.04 | 4.59 | 4.59 | 4.59 | 4.59 | 4.59 |
| Total Cash | 650,971.9 | 634,452.3 | 513,764.2 | 599,290.0 | 615,480.0 | 930,333.0 | 1,075,644.9 | 1,243,653.6 | 1,437,904.2 | 1,662,495.4 |
| Total Cash, percent | .0 | .0 | .0 | .0 | .0 | .0 | .0 | .0 | .0 | .0 |
| Account Receivables | 127,029.4 | 345,374.7 | 413,386.7 | 449,533.3 | 133,200.0 | 435,413.9 | 503,422.7 | 582,054.0 | 672,967.1 | 778,080.1 |
| Account Receivables, % | 5.09 | 12.4 | 11.95 | 10.36 | 3.03 | 8.56 | 8.56 | 8.56 | 8.56 | 8.56 |
| Inventories | 360,885.9 | 352,446.0 | 407,553.9 | 477,882.9 | 472,690.0 | 616,613.4 | 712,924.3 | 824,278.5 | 953,025.4 | 1,101,881.7 |
| Inventories, % | 14.45 | 12.66 | 11.78 | 11.01 | 10.75 | 12.13 | 12.13 | 12.13 | 12.13 | 12.13 |
| Accounts Payable | 818,342.7 | 697,503.3 | 798,364.5 | 880,429.5 | 973,680.0 | 1,253,811.1 | 1,449,648.2 | 1,676,073.8 | 1,937,865.6 | 2,240,547.5 |
| Accounts Payable, % | 32.76 | 25.05 | 23.08 | 20.29 | 22.14 | 24.66 | 24.66 | 24.66 | 24.66 | 24.66 |
| Capital Expenditure | -202,054.0 | -151,684.2 | -180,956.8 | -314,136.3 | -380,420.0 | -352,367.7 | -407,405.2 | -471,039.2 | -544,612.5 | -629,677.4 |
| Capital Expenditure, % | -8.09 | -5.45 | -5.23 | -7.24 | -8.65 | -6.93 | -6.93 | -6.93 | -6.93 | -6.93 |
| Tax Rate, % | 17.61 | 17.61 | 17.61 | 17.61 | 17.61 | 17.61 | 17.61 | 17.61 | 17.61 | 17.61 |
| EBITAT | 110,636.7 | 33,984.9 | 70,300.0 | 371,146.4 | 291,102.8 | 211,778.3 | 244,856.7 | 283,101.8 | 327,320.4 | 378,445.7 |
| Depreciation | ||||||||||
| Changes in Account Receivables | ||||||||||
| Changes in Inventories | ||||||||||
| Changes in Accounts Payable | ||||||||||
| Capital Expenditure | ||||||||||
| UFCF | 348,502.9 | -336,795.1 | -14,148.6 | 164,809.5 | 438,509.5 | -129,243.4 | 74,022.1 | 85,583.9 | 98,951.5 | 114,407.1 |
| WACC, % | 7.55 | 7.55 | 7.03 | 7.55 | 7.23 | 7.38 | 7.38 | 7.38 | 7.38 | 7.38 |
| PV UFCF | ||||||||||
| SUM PV UFCF | 167,502.2 | |||||||||
| Long Term Growth Rate, % | 2.00 | |||||||||
| Free cash flow (T + 1) | 116,695 | |||||||||
| Terminal Value | 2,168,057 | |||||||||
| Present Terminal Value | 1,518,460 | |||||||||
| Enterprise Value | 1,685,963 | |||||||||
| Net Debt | 371,910 | |||||||||
| Equity Value | 1,314,053 | |||||||||
| Diluted Shares Outstanding, MM | 3,681 | |||||||||
| Equity Value Per Share | 356.95 |
What You Will Receive
- Pre-Filled Financial Model: Tata Motors' actual data allows for accurate DCF valuation.
- Comprehensive Forecast Control: Modify revenue growth, profit margins, WACC, and other essential factors.
- Instant Calculations: Real-time updates ensure you see outcomes as you make adjustments.
- Investor-Ready Template: A polished Excel file crafted for high-quality valuation.
- Customizable and Reusable: Designed for flexibility, enabling repeated use for thorough forecasts.
Key Features
- 🔍 Real-Life TATAMOTORSNS Financials: Pre-filled historical and projected data for Tata Motors Limited.
- ✏️ Fully Customizable Inputs: Adjust all critical parameters (yellow cells) such as WACC, growth %, and tax rates.
- 📊 Professional DCF Valuation: Built-in formulas calculate Tata Motors’ intrinsic value using the Discounted Cash Flow method.
- ⚡ Instant Results: Visualize Tata Motors’ valuation instantly after making adjustments.
- Scenario Analysis: Test and compare outcomes for various financial assumptions side-by-side.
How It Functions
- 1. Access the Template: Download and open the Excel file featuring Tata Motors Limited’s (TATAMOTORSNS) preloaded data.
- 2. Adjust Assumptions: Modify key parameters such as growth rates, WACC, and capital expenditures.
- 3. Instant Results: The DCF model automatically calculates the intrinsic value and NPV.
- 4. Experiment with Scenarios: Evaluate various forecasts to explore different valuation outcomes.
- 5. Present with Confidence: Deliver professional valuation insights to inform your decisions.
Why Choose the Tata Motors Calculator?
- Save Time: Jump straight into analysis with a pre-built model, no setup required.
- Enhance Accuracy: Dependable financial data and formulas minimize valuation errors.
- Completely Customizable: Adjust the model to suit your unique assumptions and forecasts.
- User-Friendly: Intuitive charts and outputs simplify result interpretation.
- Preferred by Professionals: Tailored for industry experts who prioritize accuracy and functionality.
Who Can Benefit from This Product?
- Individual Investors: Gain insights for making educated decisions about purchasing or selling Tata Motors Limited (TATAMOTORSNS) stock.
- Financial Analysts: Enhance valuation processes with pre-built financial models tailored for Tata Motors Limited (TATAMOTORSNS).
- Consultants: Provide clients with accurate and timely valuation insights regarding Tata Motors Limited (TATAMOTORSNS).
- Business Owners: Learn how major companies like Tata Motors Limited (TATAMOTORSNS) are valued to inform your strategic planning.
- Finance Students: Explore valuation techniques through the lens of real-world examples and data related to Tata Motors Limited (TATAMOTORSNS).
Contents of the Template
- Pre-Filled DCF Model: Tata Motors Limited’s financial data preloaded for immediate use.
- WACC Calculator: Comprehensive calculations for Weighted Average Cost of Capital.
- Financial Ratios: Assess Tata Motors’ profitability, leverage, and efficiency metrics.
- Editable Inputs: Modify assumptions such as growth rates, margins, and CAPEX to match your scenarios.
- Financial Statements: Annual and quarterly reports available for in-depth analysis.
- Interactive Dashboard: Easily visualize essential valuation metrics and outcomes.
Disclaimer
All information, articles, and product details provided on this website are for general informational and educational purposes only. We do not claim any ownership over, nor do we intend to infringe upon, any trademarks, copyrights, logos, brand names, or other intellectual property mentioned or depicted on this site. Such intellectual property remains the property of its respective owners, and any references here are made solely for identification or informational purposes, without implying any affiliation, endorsement, or partnership.
We make no representations or warranties, express or implied, regarding the accuracy, completeness, or suitability of any content or products presented. Nothing on this website should be construed as legal, tax, investment, financial, medical, or other professional advice. In addition, no part of this site—including articles or product references—constitutes a solicitation, recommendation, endorsement, advertisement, or offer to buy or sell any securities, franchises, or other financial instruments, particularly in jurisdictions where such activity would be unlawful.
All content is of a general nature and may not address the specific circumstances of any individual or entity. It is not a substitute for professional advice or services. Any actions you take based on the information provided here are strictly at your own risk. You accept full responsibility for any decisions or outcomes arising from your use of this website and agree to release us from any liability in connection with your use of, or reliance upon, the content or products found herein.