
|
TBC Bank Group Plc (TBCG.L) Évaluation DCF |
Entièrement Modifiable: Adapté À Vos Besoins Dans Excel Ou Sheets
Conception Professionnelle: Modèles Fiables Et Conformes Aux Normes Du Secteur
Pré-Construits Pour Une Utilisation Rapide Et Efficace
Compatible MAC/PC, entièrement débloqué
Aucune Expertise N'Est Requise; Facile À Suivre
TBC Bank Group PLC (TBCG.L) Bundle
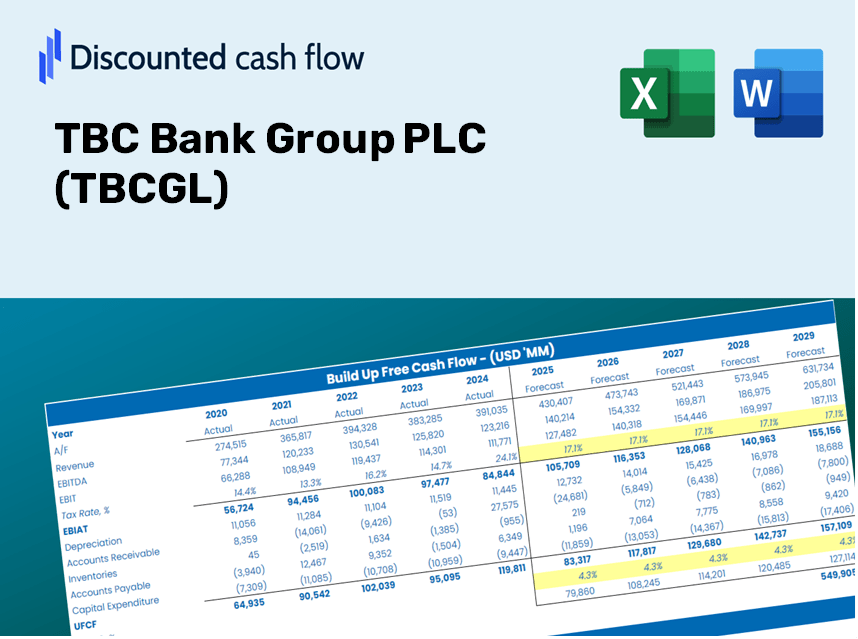
Que vous soyez un investisseur ou un analyste, cette calculatrice DCF (TBCGL) est votre ressource incontournable pour une évaluation précise. Chargé de données réelles de TBC Bank Group plc, vous pouvez ajuster vos prévisions et observer les effets en temps réel.
Discounted Cash Flow (DCF) - (USD MM)
| Year | AY1 2020 |
AY2 2021 |
AY3 2022 |
AY4 2023 |
AY5 2024 |
FY1 2025 |
FY2 2026 |
FY3 2027 |
FY4 2028 |
FY5 2029 |
|---|---|---|---|---|---|---|---|---|---|---|
| Revenue | 800.5 | 1,481.5 | 3,209.6 | 2,195.8 | 2,624.8 | 3,760.1 | 5,386.6 | 7,716.6 | 11,054.4 | 15,836.0 |
| Revenue Growth, % | 0 | 85.07 | 116.64 | -31.59 | 19.54 | 43.26 | 43.26 | 43.26 | 43.26 | 43.26 |
| EBITDA | .0 | 1,001.3 | 1,347.7 | 1,449.8 | 1,689.4 | 1,804.6 | 2,585.2 | 3,703.4 | 5,305.3 | 7,600.1 |
| EBITDA, % | 0 | 67.58 | 41.99 | 66.03 | 64.36 | 47.99 | 47.99 | 47.99 | 47.99 | 47.99 |
| Depreciation | 68.4 | 79.9 | 101.2 | 116.0 | 145.3 | 209.9 | 300.6 | 430.7 | 617.0 | 883.8 |
| Depreciation, % | 8.54 | 5.39 | 3.15 | 5.28 | 5.54 | 5.58 | 5.58 | 5.58 | 5.58 | 5.58 |
| EBIT | -68.4 | 921.4 | 1,246.5 | 1,333.8 | 1,544.1 | 1,594.7 | 2,284.5 | 3,272.7 | 4,688.3 | 6,716.3 |
| EBIT, % | -8.54 | 62.19 | 38.84 | 60.74 | 58.83 | 42.41 | 42.41 | 42.41 | 42.41 | 42.41 |
| Total Cash | 3,784.7 | 3,888.4 | 5,952.7 | 5,389.1 | 5,809.7 | 3,760.1 | 5,386.6 | 7,716.6 | 11,054.4 | 15,836.0 |
| Total Cash, percent | .0 | .0 | .0 | .0 | .0 | .0 | .0 | .0 | .0 | .0 |
| Account Receivables | 13.6 | 117.0 | 55.9 | 102.9 | 143.8 | 161.7 | 231.6 | 331.8 | 475.3 | 680.9 |
| Account Receivables, % | 1.69 | 7.9 | 1.74 | 4.69 | 5.48 | 4.3 | 4.3 | 4.3 | 4.3 | 4.3 |
| Inventories | .0 | .0 | .0 | .0 | .0 | .0 | .0 | .0 | .0 | .0 |
| Inventories, % | 0 | 0 | 0 | 0 | 0 | 0 | 0 | 0 | 0 | 0 |
| Accounts Payable | 41.4 | 59.0 | 73.1 | 121.7 | 179.4 | 179.0 | 256.4 | 367.3 | 526.2 | 753.8 |
| Accounts Payable, % | 5.17 | 3.98 | 2.28 | 5.54 | 6.84 | 4.76 | 4.76 | 4.76 | 4.76 | 4.76 |
| Capital Expenditure | -164.4 | -163.2 | -226.4 | -263.2 | -340.2 | -478.0 | -684.7 | -980.9 | -1,405.2 | -2,013.0 |
| Capital Expenditure, % | -20.53 | -11.02 | -7.05 | -11.99 | -12.96 | -12.71 | -12.71 | -12.71 | -12.71 | -12.71 |
| Tax Rate, % | 16.84 | 16.84 | 16.84 | 16.84 | 16.84 | 16.84 | 16.84 | 16.84 | 16.84 | 16.84 |
| EBITAT | -68.1 | 800.8 | 995.2 | 1,124.2 | 1,284.1 | 1,383.5 | 1,981.9 | 2,839.2 | 4,067.3 | 5,826.6 |
| Depreciation | ||||||||||
| Changes in Account Receivables | ||||||||||
| Changes in Inventories | ||||||||||
| Changes in Accounts Payable | ||||||||||
| Capital Expenditure | ||||||||||
| UFCF | -136.3 | 631.6 | 945.2 | 978.5 | 1,106.0 | 1,097.1 | 1,605.3 | 2,299.7 | 3,294.5 | 4,719.5 |
| WACC, % | 23.67 | 20.93 | 19.39 | 20.35 | 20.11 | 20.89 | 20.89 | 20.89 | 20.89 | 20.89 |
| PV UFCF | ||||||||||
| SUM PV UFCF | 6,677.9 | |||||||||
| Long Term Growth Rate, % | 2.00 | |||||||||
| Free cash flow (T + 1) | 4,814 | |||||||||
| Terminal Value | 25,483 | |||||||||
| Present Terminal Value | 9,869 | |||||||||
| Enterprise Value | 16,547 | |||||||||
| Net Debt | 457 | |||||||||
| Equity Value | 16,090 | |||||||||
| Diluted Shares Outstanding, MM | 55 | |||||||||
| Equity Value Per Share | 29,164.68 |
What You Will Gain
- Pre-Filled Financial Model: Utilize TBC Bank Group PLC’s (TBCGL) actual data for accurate DCF valuation.
- Comprehensive Forecast Control: Modify revenue growth, profit margins, WACC, and other essential metrics.
- Real-Time Calculations: Automatic updates provide immediate results as adjustments are made.
- Professional Template: A polished Excel file crafted for high-quality valuation presentations.
- Flexible and Reusable: Designed for adaptability, enabling extensive use for thorough forecasts.
Key Features
- Customizable Financial Inputs: Adjust essential parameters such as revenue growth, EBITDA %, and capital expenditures tailored for TBC Bank Group PLC (TBCGL).
- Instant DCF Valuation: Automatically computes intrinsic value, NPV, and additional metrics with speed and accuracy.
- Professional-Quality Precision: Incorporates TBC Bank Group PLC (TBCGL)'s actual financial data for reliable valuation results.
- Effortless Scenario Analysis: Easily explore various assumptions and analyze resulting impacts side by side.
- Efficiency-Oriented Solution: Streamline your valuation process by avoiding the complexities of building models from the ground up.
How It Works
- 1. Download the Template: Acquire and open the Excel file featuring TBC Bank Group PLC's (TBCGL) preloaded data.
- 2. Adjust Key Inputs: Modify essential assumptions such as growth rates, WACC, and capital expenditures.
- 3. Instant Results: The DCF model automatically computes the intrinsic value and NPV in real-time.
- 4. Scenario Analysis: Evaluate various forecasts to explore different valuation scenarios.
- 5. Present with Assurance: Deliver professional valuation insights to enhance your decision-making process.
Why Opt for This Calculator?
- Designed for Experts: A sophisticated tool favored by analysts, CFOs, and financial consultants.
- Real-Time Data: TBC Bank Group PLC’s historical and projected financials are preloaded for enhanced accuracy.
- Scenario Analysis: Effortlessly simulate various forecasts and assumptions.
- Transparent Results: Automatically computes intrinsic value, NPV, and essential metrics.
- User-Friendly: Clear, step-by-step instructions make the process straightforward.
Who Can Benefit from This Product?
- Investors: Accurately assess TBC Bank Group PLC's (TBCGL) fair value prior to making investment choices.
- CFOs: Utilize a professional-grade DCF model for financial reporting and analysis related to TBC Bank Group PLC (TBCGL).
- Consultants: Easily modify the template for creating valuation reports focused on TBC Bank Group PLC (TBCGL) for clients.
- Entrepreneurs: Acquire knowledge on financial modeling practices employed by leading banks like TBC Bank Group PLC (TBCGL).
- Educators: Employ this resource as a teaching aid to illustrate valuation techniques relevant to TBC Bank Group PLC (TBCGL).
Contents of the Template
- Operating and Balance Sheet Data: Pre-filled TBC Bank Group PLC (TBCGL) historical data and forecasts, including revenue, EBITDA, EBIT, and capital expenditures.
- WACC Calculation: A specific sheet for calculating the Weighted Average Cost of Capital (WACC), featuring parameters such as Beta, risk-free rate, and share price.
- DCF Valuation (Unlevered and Levered): Customizable Discounted Cash Flow models that present intrinsic value alongside detailed calculations.
- Financial Statements: Pre-loaded annual and quarterly financial statements to aid in analysis.
- Key Ratios: Includes profitability, leverage, and efficiency ratios relevant to TBC Bank Group PLC (TBCGL).
- Dashboard and Charts: A visual overview of valuation outputs and assumptions, designed for easy analysis of results.
Disclaimer
All information, articles, and product details provided on this website are for general informational and educational purposes only. We do not claim any ownership over, nor do we intend to infringe upon, any trademarks, copyrights, logos, brand names, or other intellectual property mentioned or depicted on this site. Such intellectual property remains the property of its respective owners, and any references here are made solely for identification or informational purposes, without implying any affiliation, endorsement, or partnership.
We make no representations or warranties, express or implied, regarding the accuracy, completeness, or suitability of any content or products presented. Nothing on this website should be construed as legal, tax, investment, financial, medical, or other professional advice. In addition, no part of this site—including articles or product references—constitutes a solicitation, recommendation, endorsement, advertisement, or offer to buy or sell any securities, franchises, or other financial instruments, particularly in jurisdictions where such activity would be unlawful.
All content is of a general nature and may not address the specific circumstances of any individual or entity. It is not a substitute for professional advice or services. Any actions you take based on the information provided here are strictly at your own risk. You accept full responsibility for any decisions or outcomes arising from your use of this website and agree to release us from any liability in connection with your use of, or reliance upon, the content or products found herein.