
|
United Breweries Limited (UBL.NS) Évaluation DCF |
Entièrement Modifiable: Adapté À Vos Besoins Dans Excel Ou Sheets
Conception Professionnelle: Modèles Fiables Et Conformes Aux Normes Du Secteur
Pré-Construits Pour Une Utilisation Rapide Et Efficace
Compatible MAC/PC, entièrement débloqué
Aucune Expertise N'Est Requise; Facile À Suivre
United Breweries Limited (UBL.NS) Bundle
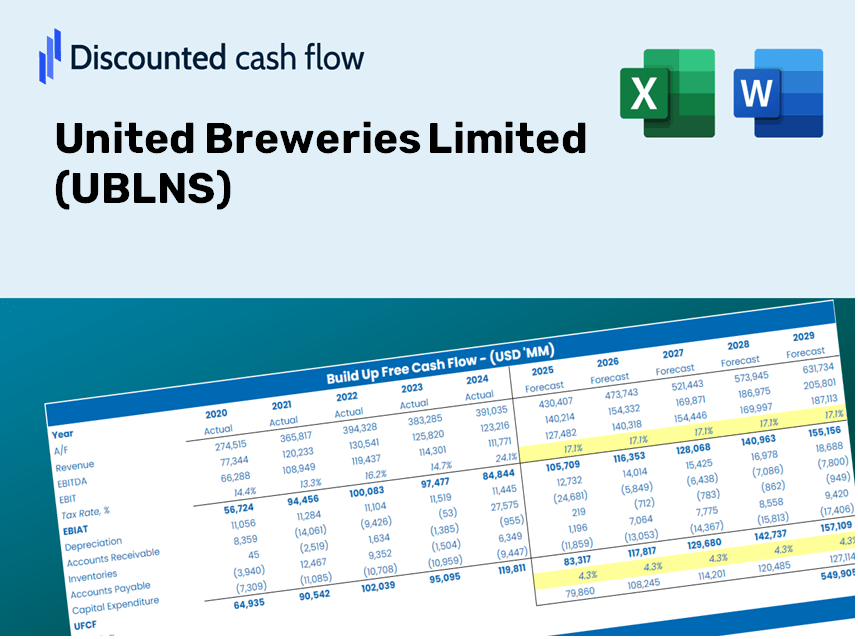
Conçu pour la précision, notre calculatrice DCF (UBLNS) vous permet d'évaluer l'évaluation de United Breweries Limited avec des données financières authentiques et une flexibilité complète pour modifier tous les paramètres essentiels pour des projections améliorées.
Benefits You Will Enjoy
- Flexible Forecast Inputs: Effortlessly modify key assumptions (growth %, margins, WACC) to develop various scenarios.
- Real-Time Data: United Breweries Limited (UBLNS) financial figures pre-loaded to streamline your analysis.
- Automated DCF Outputs: The template computes Net Present Value (NPV) and intrinsic value on your behalf.
- Customizable and Professional Layout: An elegant Excel model tailored to meet your valuation requirements.
- Designed for Analysts and Investors: Perfect for assessing projections, verifying strategies, and enhancing efficiency.
Key Features
- 🔍 Real-Life UBLNS Financials: Pre-filled historical and projected data for United Breweries Limited.
- ✏️ Fully Customizable Inputs: Fine-tune all essential parameters (yellow cells) such as WACC, growth %, and tax rates.
- 📊 Professional DCF Valuation: Integrated formulas calculate the intrinsic value of United Breweries using the Discounted Cash Flow method.
- ⚡ Instant Results: See United Breweries’ valuation in real-time after making adjustments.
- Scenario Analysis: Evaluate and compare different outcomes for various financial assumptions side-by-side.
How It Functions
- Download: Get the pre-loaded Excel file featuring United Breweries Limited’s (UBLNS) financial data.
- Customize: Tailor your forecasts, including revenue growth, EBITDA %, and WACC.
- Automatic Updates: The intrinsic value and NPV calculations refresh in real time.
- Scenario Testing: Generate various projections and instantly compare results.
- Make Informed Decisions: Utilize the valuation results to shape your investment approach.
Why Opt for the UBLNS Calculator?
- Time-Efficient: Skip the hassle of building a DCF model from the ground up – it’s ready for immediate use.
- Enhanced Precision: Dependable financial data and formulas minimize valuation errors.
- Completely Customizable: Adjust the model to align with your assumptions and forecasts.
- User-Friendly Insights: Intuitive charts and outputs facilitate straightforward analysis of results.
- Endorsed by Professionals: Crafted for experts who prioritize accuracy and ease of use.
Who Can Benefit from This Product?
- Finance Students: Master valuation methods and practice with real data specific to United Breweries Limited (UBLNS).
- Researchers: Embed industry-standard models into academic projects or studies related to UBLNS.
- Investors: Validate your own insights and examine valuation results for United Breweries Limited (UBLNS).
- Financial Analysts: Enhance your efficiency with a ready-made, customizable DCF model tailored for UBLNS.
- Small Business Owners: Discover how major public entities like United Breweries Limited (UBLNS) are evaluated and analyzed.
Contents of the Template
- Preloaded UBLNS Data: Historical and projected financial metrics, including revenue, EBIT, and capital expenditures.
- DCF and WACC Models: Advanced spreadsheets designed for calculating intrinsic value and Weighted Average Cost of Capital.
- Editable Inputs: Yellow-highlighted cells for modifying revenue growth, tax rates, and discount rates.
- Financial Statements: Detailed annual and quarterly financial data for in-depth analysis.
- Key Ratios: Ratios for profitability, leverage, and efficiency to assess performance.
- Dashboard and Charts: Visual representations of valuation results and underlying assumptions.
Disclaimer
All information, articles, and product details provided on this website are for general informational and educational purposes only. We do not claim any ownership over, nor do we intend to infringe upon, any trademarks, copyrights, logos, brand names, or other intellectual property mentioned or depicted on this site. Such intellectual property remains the property of its respective owners, and any references here are made solely for identification or informational purposes, without implying any affiliation, endorsement, or partnership.
We make no representations or warranties, express or implied, regarding the accuracy, completeness, or suitability of any content or products presented. Nothing on this website should be construed as legal, tax, investment, financial, medical, or other professional advice. In addition, no part of this site—including articles or product references—constitutes a solicitation, recommendation, endorsement, advertisement, or offer to buy or sell any securities, franchises, or other financial instruments, particularly in jurisdictions where such activity would be unlawful.
All content is of a general nature and may not address the specific circumstances of any individual or entity. It is not a substitute for professional advice or services. Any actions you take based on the information provided here are strictly at your own risk. You accept full responsibility for any decisions or outcomes arising from your use of this website and agree to release us from any liability in connection with your use of, or reliance upon, the content or products found herein.