
|
Van Lanschot Kempen NV (vlk.as) Valation DCF |
Entièrement Modifiable: Adapté À Vos Besoins Dans Excel Ou Sheets
Conception Professionnelle: Modèles Fiables Et Conformes Aux Normes Du Secteur
Pré-Construits Pour Une Utilisation Rapide Et Efficace
Compatible MAC/PC, entièrement débloqué
Aucune Expertise N'Est Requise; Facile À Suivre
Van Lanschot Kempen NV (VLK.AS) Bundle
Gardez un aperçu de votre analyse d'évaluation Van Lanschot Kempen NV (VLKAS) à l'aide de notre calculatrice sophistiquée DCF! Ce modèle Excel est préchargé avec des données réelles (VLKAS), vous permettant d'ajuster les prévisions et les hypothèses pour déterminer avec précision la valeur intrinsèque de Van Lanschot Kempen NV.
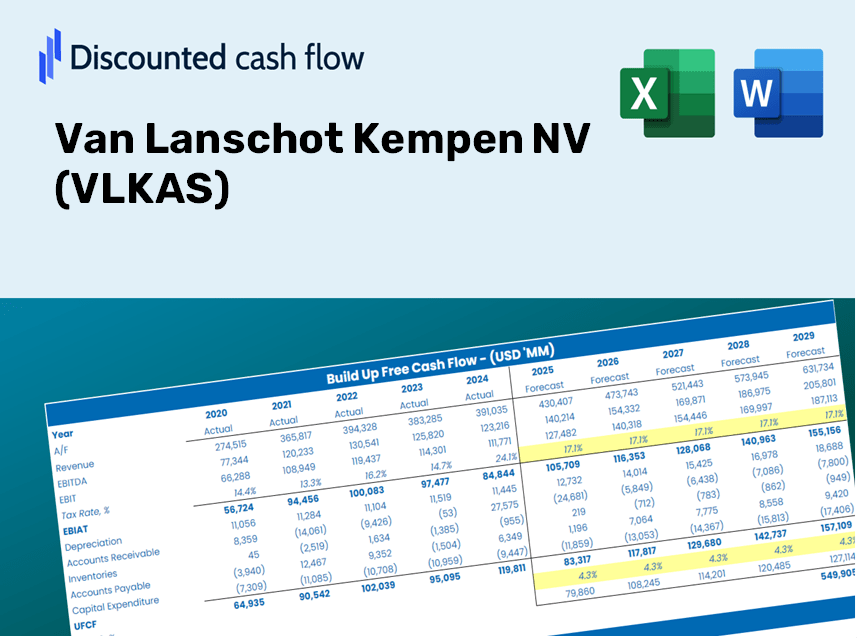
Discounted Cash Flow (DCF) - (USD MM)
| Year | AY1 2020 |
AY2 2021 |
AY3 2022 |
AY4 2023 |
AY5 2024 |
FY1 2025 |
FY2 2026 |
FY3 2027 |
FY4 2028 |
FY5 2029 |
|---|---|---|---|---|---|---|---|---|---|---|
| Revenue | 440.9 | 616.5 | 592.9 | 667.3 | 717.5 | 818.2 | 932.9 | 1,063.7 | 1,212.9 | 1,383.0 |
| Revenue Growth, % | 0 | 39.85 | -3.84 | 12.56 | 7.52 | 14.02 | 14.02 | 14.02 | 14.02 | 14.02 |
| EBITDA | 69.4 | 195.5 | 141.7 | 188.1 | .0 | 162.9 | 185.7 | 211.7 | 241.4 | 275.3 |
| EBITDA, % | 15.74 | 31.71 | 23.9 | 28.18 | 0 | 19.91 | 19.91 | 19.91 | 19.91 | 19.91 |
| Depreciation | 27.4 | 29.5 | 31.6 | 32.5 | 34.3 | 42.5 | 48.5 | 55.3 | 63.0 | 71.8 |
| Depreciation, % | 6.21 | 4.79 | 5.34 | 4.86 | 4.78 | 5.19 | 5.19 | 5.19 | 5.19 | 5.19 |
| EBIT | 42.0 | 166.0 | 110.0 | 155.6 | -34.3 | 120.4 | 137.2 | 156.5 | 178.4 | 203.4 |
| EBIT, % | 9.53 | 26.92 | 18.56 | 23.32 | -4.78 | 14.71 | 14.71 | 14.71 | 14.71 | 14.71 |
| Total Cash | 2,629.5 | 4,242.7 | 3,763.8 | 3,356.1 | 2,489.1 | 818.2 | 932.9 | 1,063.7 | 1,212.9 | 1,383.0 |
| Total Cash, percent | .0 | .0 | .0 | .0 | .0 | .0 | .0 | .0 | .0 | .0 |
| Account Receivables | 97.0 | 124.1 | 116.5 | 134.1 | 155.3 | 169.4 | 193.2 | 220.2 | 251.1 | 286.3 |
| Account Receivables, % | 22 | 20.13 | 19.65 | 20.1 | 21.64 | 20.71 | 20.71 | 20.71 | 20.71 | 20.71 |
| Inventories | .0 | -3,927.0 | -3,371.2 | .0 | .0 | -327.3 | -373.2 | -425.5 | -485.2 | -553.2 |
| Inventories, % | 0 | -636.95 | -568.63 | 0 | 0 | -40 | -40 | -40 | -40 | -40 |
| Accounts Payable | 17.2 | 9.8 | 30.9 | 73.5 | 75.4 | 52.7 | 60.1 | 68.6 | 78.2 | 89.2 |
| Accounts Payable, % | 3.89 | 1.6 | 5.22 | 11.02 | 10.51 | 6.45 | 6.45 | 6.45 | 6.45 | 6.45 |
| Capital Expenditure | -32.4 | -192.1 | -11.3 | -19.0 | -26.8 | -76.9 | -87.7 | -100.0 | -114.0 | -130.0 |
| Capital Expenditure, % | -7.36 | -31.17 | -1.9 | -2.84 | -3.73 | -9.4 | -9.4 | -9.4 | -9.4 | -9.4 |
| Tax Rate, % | 26.75 | 26.75 | 26.75 | 26.75 | 26.75 | 26.75 | 26.75 | 26.75 | 26.75 | 26.75 |
| EBITAT | 38.6 | 133.7 | 77.8 | 118.7 | -25.1 | 94.5 | 107.7 | 122.9 | 140.1 | 159.7 |
| Depreciation | ||||||||||
| Changes in Account Receivables | ||||||||||
| Changes in Inventories | ||||||||||
| Changes in Accounts Payable | ||||||||||
| Capital Expenditure | ||||||||||
| UFCF | -46.3 | 3,863.6 | -428.9 | -3,214.1 | -36.9 | 350.6 | 98.1 | 111.8 | 127.5 | 145.4 |
| WACC, % | 13.56 | 12.35 | 11.29 | 11.89 | 11.56 | 12.13 | 12.13 | 12.13 | 12.13 | 12.13 |
| PV UFCF | ||||||||||
| SUM PV UFCF | 632.6 | |||||||||
| Long Term Growth Rate, % | 2.00 | |||||||||
| Free cash flow (T + 1) | 148 | |||||||||
| Terminal Value | 1,463 | |||||||||
| Present Terminal Value | 826 | |||||||||
| Enterprise Value | 1,458 | |||||||||
| Net Debt | -2,489 | |||||||||
| Equity Value | 3,947 | |||||||||
| Diluted Shares Outstanding, MM | 43 | |||||||||
| Equity Value Per Share | 92.77 |
What You Will Receive
- Adjustable Forecast Variables: Easily modify assumptions (growth %, margins, WACC) to explore various scenarios.
- Real-Time Financial Data: Van Lanschot Kempen NV’s (VLKAS) financial information is pre-loaded to facilitate your analysis.
- Automated DCF Calculations: The model computes Net Present Value (NPV) and intrinsic value automatically.
- Professional and Tailorable: A refined Excel template that can be customized to meet your valuation requirements.
- Designed for Analysts and Investors: Perfect for evaluating projections, confirming strategies, and enhancing efficiency.
Key Features
- Comprehensive VLKAS Data: Pre-loaded with Van Lanschot Kempen NV's historical financials and future projections.
- Fully Customizable Parameters: Modify revenue growth rates, profit margins, WACC, tax rates, and capital expenditure assumptions.
- Interactive Valuation Model: Automatically recalculates Net Present Value (NPV) and intrinsic value according to your changes.
- Scenario Analysis: Generate multiple forecasting scenarios to explore various valuation potential.
- Intuitive Interface: Designed for ease of use, catering to both seasoned professionals and newcomers.
How It Works
- Step 1: Download the Excel file for Van Lanschot Kempen NV (VLKAS).
- Step 2: Examine the pre-filled historical and projected data for VLKAS.
- Step 3: Modify the key assumptions (highlighted in yellow) based on your insights.
- Step 4: Observe the automatic recalculation of Van Lanschot Kempen NV's intrinsic value.
- Step 5: Utilize the results for your investment strategies or reporting needs.
Why Opt for This Calculator?
- Designed for Experts: A sophisticated tool crafted for analysts, CFOs, and consultants.
- Comprehensive Data: VLKAS's historical and projected financials are preloaded for enhanced precision.
- What-If Analysis: Effortlessly simulate various forecasts and assumptions.
- Transparent Results: Automatically computes intrinsic value, NPV, and essential metrics.
- User-Friendly: Clear, step-by-step instructions to navigate the process smoothly.
Who Can Benefit from Our Services?
- Institutional Investors: Develop comprehensive and accurate valuation models for investment strategies involving Van Lanschot Kempen NV (VLKAS).
- Corporate Finance Departments: Evaluate valuation scenarios to inform and shape corporate strategy.
- Financial Consultants and Advisors: Offer clients precise valuation analyses for Van Lanschot Kempen NV (VLKAS).
- Students and Academia: Utilize real market data to enhance learning and practice in financial modeling.
- Finance Enthusiasts: Gain insights into how firms like Van Lanschot Kempen NV (VLKAS) are valued in the financial landscape.
Contents of the Template
- Historical Data: Comprises Van Lanschot Kempen NV's (VLKAS) past financials and foundational forecasts.
- DCF and Levered DCF Models: Comprehensive templates for determining the intrinsic value of Van Lanschot Kempen NV (VLKAS).
- WACC Sheet: Pre-configured calculations for the Weighted Average Cost of Capital.
- Editable Inputs: Adjust essential parameters such as growth rates, EBITDA %, and CAPEX projections.
- Quarterly and Annual Statements: A thorough analysis of Van Lanschot Kempen NV's (VLKAS) financials.
- Interactive Dashboard: Visualize valuation outcomes and projections in a dynamic format.
Disclaimer
All information, articles, and product details provided on this website are for general informational and educational purposes only. We do not claim any ownership over, nor do we intend to infringe upon, any trademarks, copyrights, logos, brand names, or other intellectual property mentioned or depicted on this site. Such intellectual property remains the property of its respective owners, and any references here are made solely for identification or informational purposes, without implying any affiliation, endorsement, or partnership.
We make no representations or warranties, express or implied, regarding the accuracy, completeness, or suitability of any content or products presented. Nothing on this website should be construed as legal, tax, investment, financial, medical, or other professional advice. In addition, no part of this site—including articles or product references—constitutes a solicitation, recommendation, endorsement, advertisement, or offer to buy or sell any securities, franchises, or other financial instruments, particularly in jurisdictions where such activity would be unlawful.
All content is of a general nature and may not address the specific circumstances of any individual or entity. It is not a substitute for professional advice or services. Any actions you take based on the information provided here are strictly at your own risk. You accept full responsibility for any decisions or outcomes arising from your use of this website and agree to release us from any liability in connection with your use of, or reliance upon, the content or products found herein.