
|
Van Lanschot Kempen NV (VLK.AS) تقييم DCF |
Fully Editable: Tailor To Your Needs In Excel Or Sheets
Professional Design: Trusted, Industry-Standard Templates
Investor-Approved Valuation Models
MAC/PC Compatible, Fully Unlocked
No Expertise Is Needed; Easy To Follow
Van Lanschot Kempen NV (VLK.AS) Bundle
اكتساب نظرة ثاقبة على تحليل تقييم Van Lanschot Kempen NV (VLKAS) باستخدام حاسبة DCF المتطورة! يأتي قالب Excel هذا مسبقًا مع بيانات حقيقية (VLKAs) ، مما يتيح لك ضبط التوقعات والافتراضات لتحديد القيمة الجوهرية لفان Lanschot Kempen NV بدقة.
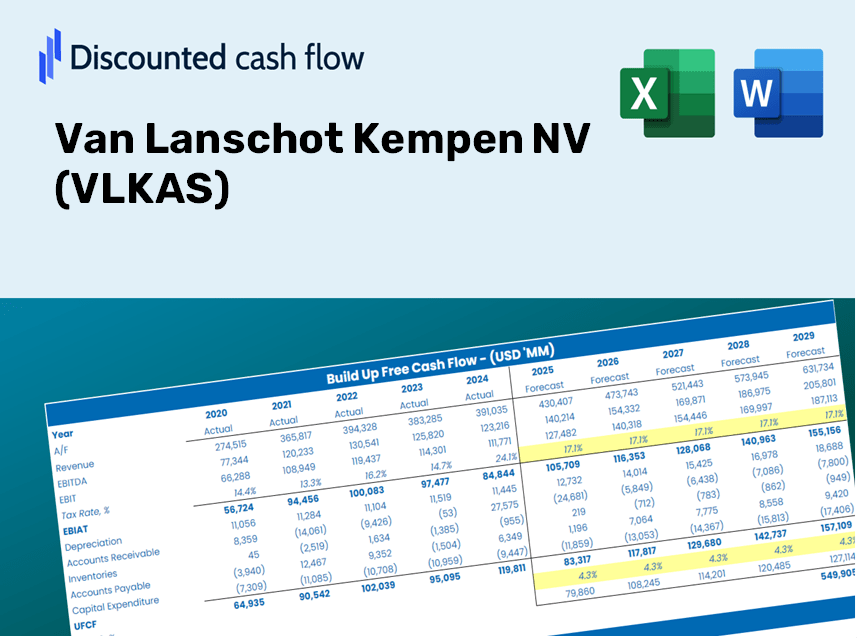
Discounted Cash Flow (DCF) - (USD MM)
| Year | AY1 2020 |
AY2 2021 |
AY3 2022 |
AY4 2023 |
AY5 2024 |
FY1 2025 |
FY2 2026 |
FY3 2027 |
FY4 2028 |
FY5 2029 |
|---|---|---|---|---|---|---|---|---|---|---|
| Revenue | 440.9 | 616.5 | 592.9 | 667.3 | 717.5 | 818.2 | 932.9 | 1,063.7 | 1,212.9 | 1,383.0 |
| Revenue Growth, % | 0 | 39.85 | -3.84 | 12.56 | 7.52 | 14.02 | 14.02 | 14.02 | 14.02 | 14.02 |
| EBITDA | 69.4 | 195.5 | 141.7 | 188.1 | .0 | 162.9 | 185.7 | 211.7 | 241.4 | 275.3 |
| EBITDA, % | 15.74 | 31.71 | 23.9 | 28.18 | 0 | 19.91 | 19.91 | 19.91 | 19.91 | 19.91 |
| Depreciation | 27.4 | 29.5 | 31.6 | 32.5 | 34.3 | 42.5 | 48.5 | 55.3 | 63.0 | 71.8 |
| Depreciation, % | 6.21 | 4.79 | 5.34 | 4.86 | 4.78 | 5.19 | 5.19 | 5.19 | 5.19 | 5.19 |
| EBIT | 42.0 | 166.0 | 110.0 | 155.6 | -34.3 | 120.4 | 137.2 | 156.5 | 178.4 | 203.4 |
| EBIT, % | 9.53 | 26.92 | 18.56 | 23.32 | -4.78 | 14.71 | 14.71 | 14.71 | 14.71 | 14.71 |
| Total Cash | 2,629.5 | 4,242.7 | 3,763.8 | 3,356.1 | 2,489.1 | 818.2 | 932.9 | 1,063.7 | 1,212.9 | 1,383.0 |
| Total Cash, percent | .0 | .0 | .0 | .0 | .0 | .0 | .0 | .0 | .0 | .0 |
| Account Receivables | 97.0 | 124.1 | 116.5 | 134.1 | 155.3 | 169.4 | 193.2 | 220.2 | 251.1 | 286.3 |
| Account Receivables, % | 22 | 20.13 | 19.65 | 20.1 | 21.64 | 20.71 | 20.71 | 20.71 | 20.71 | 20.71 |
| Inventories | .0 | -3,927.0 | -3,371.2 | .0 | .0 | -327.3 | -373.2 | -425.5 | -485.2 | -553.2 |
| Inventories, % | 0 | -636.95 | -568.63 | 0 | 0 | -40 | -40 | -40 | -40 | -40 |
| Accounts Payable | 17.2 | 9.8 | 30.9 | 73.5 | 75.4 | 52.7 | 60.1 | 68.6 | 78.2 | 89.2 |
| Accounts Payable, % | 3.89 | 1.6 | 5.22 | 11.02 | 10.51 | 6.45 | 6.45 | 6.45 | 6.45 | 6.45 |
| Capital Expenditure | -32.4 | -192.1 | -11.3 | -19.0 | -26.8 | -76.9 | -87.7 | -100.0 | -114.0 | -130.0 |
| Capital Expenditure, % | -7.36 | -31.17 | -1.9 | -2.84 | -3.73 | -9.4 | -9.4 | -9.4 | -9.4 | -9.4 |
| Tax Rate, % | 26.75 | 26.75 | 26.75 | 26.75 | 26.75 | 26.75 | 26.75 | 26.75 | 26.75 | 26.75 |
| EBITAT | 38.6 | 133.7 | 77.8 | 118.7 | -25.1 | 94.5 | 107.7 | 122.9 | 140.1 | 159.7 |
| Depreciation | ||||||||||
| Changes in Account Receivables | ||||||||||
| Changes in Inventories | ||||||||||
| Changes in Accounts Payable | ||||||||||
| Capital Expenditure | ||||||||||
| UFCF | -46.3 | 3,863.6 | -428.9 | -3,214.1 | -36.9 | 350.6 | 98.1 | 111.8 | 127.5 | 145.4 |
| WACC, % | 13.56 | 12.35 | 11.29 | 11.89 | 11.56 | 12.13 | 12.13 | 12.13 | 12.13 | 12.13 |
| PV UFCF | ||||||||||
| SUM PV UFCF | 632.6 | |||||||||
| Long Term Growth Rate, % | 2.00 | |||||||||
| Free cash flow (T + 1) | 148 | |||||||||
| Terminal Value | 1,463 | |||||||||
| Present Terminal Value | 826 | |||||||||
| Enterprise Value | 1,458 | |||||||||
| Net Debt | -2,489 | |||||||||
| Equity Value | 3,947 | |||||||||
| Diluted Shares Outstanding, MM | 43 | |||||||||
| Equity Value Per Share | 92.77 |
ماذا ستتلقى
- متغيرات التنبؤ القابلة للتعديل: تعديل الافتراضات بسهولة (النمو ٪ ، الهوامش ، WACC) لاستكشاف السيناريوهات المختلفة.
- البيانات المالية في الوقت الحقيقي: يتم تحميل المعلومات المالية Van Lanschot Kempen NV (VLKAS) مسبقًا لتسهيل تحليلك.
- حسابات DCF الآلية: يحسب النموذج القيمة الحالية الصافية (NPV) والقيمة الجوهرية تلقائيًا.
- احترافي وذاتح: قالب Excel المكرر الذي يمكن تخصيصه لتلبية متطلبات التقييم الخاصة بك.
- مصمم للمحللين والمستثمرين: مثالي لتقييم التوقعات ، وتأكيد الاستراتيجيات ، وتعزيز الكفاءة.
الميزات الرئيسية
- بيانات VLKAS الشاملة: تم تحميله مسبقًا مع البيانات المالية التاريخية لـ Van Lanschot Kempen NV والتوقعات المستقبلية.
- المعلمات القابلة للتخصيص بالكامل: تعديل معدلات نمو الإيرادات ، هوامش الربح ، WACC ، معدلات الضرائب ، وافتراضات الإنفاق الرأسمالي.
- نموذج التقييم التفاعلي: يعيد حساب القيمة الحالية الصافية (NPV) وقيمة جوهرية وفقًا لتغييراتك.
- تحليل السيناريو: توليد سيناريوهات تنبؤ متعددة لاستكشاف إمكانات التقييم المختلفة.
- واجهة بديهية: تم تصميمه لسهولة الاستخدام ، والتموين لكل من المحترفين المتمرسين والوافدين الجدد.
كيف تعمل
- الخطوة 1: قم بتنزيل ملف Excel لفان Lanschot Kempen NV (VLKAS).
- الخطوة 2: فحص البيانات التاريخية والمتوقعة المليئة مسبقًا بـ VLKAs.
- الخطوة 3: قم بتعديل الافتراضات الرئيسية (المميزة باللون الأصفر) بناءً على رؤيتك.
- الخطوة 4: راقب إعادة حساب التلقائي لقيمة Van Lanschot Kempen NV.
- الخطوة 5: الاستفادة من نتائج استراتيجيات الاستثمار الخاصة بك أو احتياجات الإبلاغ.
لماذا تختار هذه الآلة الحاسبة؟
- مصمم للخبراء: أداة متطورة مصنوعة للمحللين والمديرين الماليين والمستشارين.
- بيانات شاملة: يتم تحميل البيانات المالية التاريخية والمتوقعة لفلكاس لدقة محسنة.
- ما إذا كان التحليل: محاكاة مختلف التوقعات والافتراضات.
- نتائج شفافة: يحسب تلقائيًا القيمة الجوهرية ، NPV ، والمقاييس الأساسية.
- سهل الاستخدام: واضحة ، تعليمات خطوة بخطوة للتنقل في العملية بسلاسة.
من يمكنه الاستفادة من خدماتنا؟
- المستثمرون المؤسسيون: تطوير نماذج تقييم شاملة ودقيقة لاستراتيجيات الاستثمار التي تشمل Van Lanschot Kempen NV (VLKAS).
- إدارات تمويل الشركات: تقييم سيناريوهات التقييم لإبلاغ وتشكيل استراتيجية الشركة.
- المستشارون والمستشارون الماليون: عرض على العملاء تحليلات تقييم دقيقة لفان Lanschot Kempen NV (VLKAS).
- الطلاب والأوساط الأكاديمية: الاستفادة من بيانات السوق الحقيقية لتعزيز التعلم والممارسة في النمذجة المالية.
- عشاق المالية: اكتساب رؤى حول كيفية تقدير شركات مثل Van Lanschot Kempen NV (VLKAs) في المشهد المالي.
محتويات النموذج
- البيانات التاريخية: تتألف من البيانات المالية والتوقعات التأسيسية السابقة لشركة Van Lanschot Kempen NV (VLKAS).
- نماذج DCF و Levered DCF: نماذج شاملة لتحديد القيمة الجوهرية لـ Van Lanschot Kempen NV (VLKAS).
- ورقة WACC: حسابات معدة مسبقًا للمتوسط المرجح لتكلفة رأس المال.
- المدخلات القابلة للتحرير: ضبط المعلمات الأساسية مثل معدلات النمو، EBITDA٪، وتوقعات CAPEX.
- البيانات الفصلية والسنوية: تحليل شامل للبيانات المالية لشركة Van Lanschot Kempen NV (VLKAS).
- لوحة القيادة التفاعلية: تصور نتائج التقييم والإسقاطات في شكل دينامي.
Disclaimer
All information, articles, and product details provided on this website are for general informational and educational purposes only. We do not claim any ownership over, nor do we intend to infringe upon, any trademarks, copyrights, logos, brand names, or other intellectual property mentioned or depicted on this site. Such intellectual property remains the property of its respective owners, and any references here are made solely for identification or informational purposes, without implying any affiliation, endorsement, or partnership.
We make no representations or warranties, express or implied, regarding the accuracy, completeness, or suitability of any content or products presented. Nothing on this website should be construed as legal, tax, investment, financial, medical, or other professional advice. In addition, no part of this site—including articles or product references—constitutes a solicitation, recommendation, endorsement, advertisement, or offer to buy or sell any securities, franchises, or other financial instruments, particularly in jurisdictions where such activity would be unlawful.
All content is of a general nature and may not address the specific circumstances of any individual or entity. It is not a substitute for professional advice or services. Any actions you take based on the information provided here are strictly at your own risk. You accept full responsibility for any decisions or outcomes arising from your use of this website and agree to release us from any liability in connection with your use of, or reliance upon, the content or products found herein.