
|
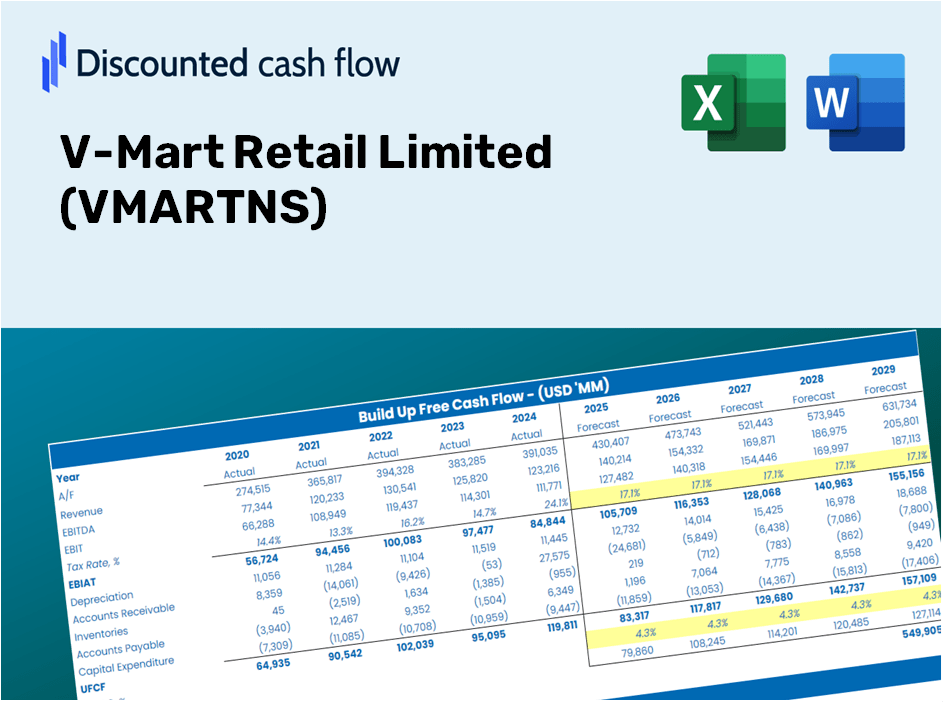
V-Mart Retail Limited (VMART.NS) DCF Valuation |
Entièrement Modifiable: Adapté À Vos Besoins Dans Excel Ou Sheets
Conception Professionnelle: Modèles Fiables Et Conformes Aux Normes Du Secteur
Pré-Construits Pour Une Utilisation Rapide Et Efficace
Compatible MAC/PC, entièrement débloqué
Aucune Expertise N'Est Requise; Facile À Suivre
V-Mart Retail Limited (VMART.NS) Bundle
Discover the true value of V-Mart Retail Limited (VMARTNS) with our advanced DCF Calculator! Adjust critical assumptions, explore various scenarios, and examine how alterations affect V-Mart Retail Limited (VMARTNS) valuation – all within one convenient Excel template.
Discounted Cash Flow (DCF) - (USD MM)
| Year | AY1 2021 |
AY2 2022 |
AY3 2023 |
AY4 2024 |
AY5 2025 |
FY1 2026 |
FY2 2027 |
FY3 2028 |
FY4 2029 |
FY5 2030 |
|---|---|---|---|---|---|---|---|---|---|---|
| Revenue | 10,754.6 | 16,661.8 | 24,648.4 | 27,808.4 | 32,538.6 | 35,951.3 | 38,276.3 | 39,802.6 | 40,781.3 | 41,399.5 |
| Revenue Growth, % | 0 | 54.93 | 47.93 | 12.82 | 17.01 | 10.49 | 6.47 | 3.99 | 2.46 | 1.52 |
| EBITDA | 1,522.5 | 2,182.9 | 2,835.4 | 2,340.0 | 3,771.1 | 4,225.4 | 4,498.7 | 4,678.1 | 4,793.1 | 4,865.7 |
| EBITDA, % | 14.16 | 13.1 | 11.5 | 8.41 | 11.59 | 11.75 | 11.75 | 11.75 | 11.75 | 11.75 |
| Depreciation | 1,029.7 | 1,307.0 | 1,799.8 | 2,221.3 | 2,329.9 | 2,866.7 | 3,052.1 | 3,173.8 | 3,251.8 | 3,301.1 |
| Depreciation, % | 9.57 | 7.84 | 7.3 | 7.99 | 7.16 | 7.97 | 7.97 | 7.97 | 7.97 | 7.97 |
| EBIT | 492.8 | 875.9 | 1,035.6 | 118.7 | 1,441.2 | 1,358.7 | 1,446.6 | 1,504.3 | 1,541.3 | 1,564.6 |
| EBIT, % | 4.58 | 5.26 | 4.2 | 0.42685 | 4.43 | 3.78 | 3.78 | 3.78 | 3.78 | 3.78 |
| Total Cash | 4,091.6 | 1,541.0 | 286.9 | 488.5 | 444.7 | 3,708.8 | 3,948.7 | 4,106.1 | 4,207.1 | 4,270.9 |
| Total Cash, percent | .0 | .0 | .0 | .0 | .0 | .0 | .0 | .0 | .0 | .0 |
| Account Receivables | 26.0 | 34.0 | 207.0 | 295.0 | 169.7 | 238.4 | 307.9 | 376.3 | 443.1 | 508.0 |
| Account Receivables, % | 0.24201 | 0.20383 | 0.8398 | 1.06 | 0.52153 | 0.66306 | 0.80438 | 0.9455 | 1.09 | 1.23 |
| Inventories | 4,283.1 | 6,959.1 | 8,997.5 | 8,160.7 | 9,868.3 | 12,782.1 | 13,608.7 | 14,151.4 | 14,499.3 | 14,719.2 |
| Inventories, % | 39.83 | 41.77 | 36.5 | 29.35 | 30.33 | 35.55 | 35.55 | 35.55 | 35.55 | 35.55 |
| Accounts Payable | 1,916.8 | 2,905.7 | 4,884.8 | 6,336.6 | 7,619.8 | 8,985.7 | 10,157.7 | 11,164.6 | 12,043.0 | 12,826.1 |
| Accounts Payable, % | 17.82 | 17.44 | 19.82 | 22.79 | 23.42 | 24.99 | 26.54 | 28.05 | 29.53 | 30.98 |
| Capital Expenditure | -410.2 | -1,511.6 | -2,783.2 | -1,209.1 | -1,238.2 | -2,324.7 | -2,475.0 | -2,573.7 | -2,637.0 | -2,677.0 |
| Capital Expenditure, % | -3.81 | -9.07 | -11.29 | -4.35 | -3.81 | -6.47 | -6.47 | -6.47 | -6.47 | -6.47 |
| Tax Rate, % | -4.12 | -4.12 | -4.12 | -4.12 | -4.12 | -4.12 | -4.12 | -4.12 | -4.12 | -4.12 |
| EBITAT | 316.3 | 980.7 | 624.8 | 88.0 | 1,500.5 | 1,083.3 | 1,153.4 | 1,199.4 | 1,228.9 | 1,247.5 |
| Depreciation | ||||||||||
| Changes in Account Receivables | ||||||||||
| Changes in Inventories | ||||||||||
| Changes in Accounts Payable | ||||||||||
| Capital Expenditure | ||||||||||
| UFCF | -1,456.5 | -919.0 | -591.0 | 3,300.8 | 2,293.1 | 8.7 | 2,006.3 | 2,195.2 | 2,307.4 | 2,369.9 |
| WACC, % | 7.46 | 10.15 | 7.17 | 8.21 | 10.15 | 8.63 | 8.63 | 8.63 | 8.63 | 8.63 |
| PV UFCF | ||||||||||
| SUM PV UFCF | 6,644.9 | |||||||||
| Long Term Growth Rate, % | 4.00 | |||||||||
| Free cash flow (T + 1) | 2,465 | |||||||||
| Terminal Value | 53,260 | |||||||||
| Present Terminal Value | 35,213 | |||||||||
| Enterprise Value | 41,858 | |||||||||
| Net Debt | 7,431 | |||||||||
| Equity Value | 34,427 | |||||||||
| Diluted Shares Outstanding, MM | 20 | |||||||||
| Equity Value Per Share | 1,721.69 |
Benefits of Choosing V-Mart Retail Limited (VMARTNS)
- Genuine VMARTNS Financial Data: Access to both historical and projected figures for precise valuation.
- Customizable Inputs: Adjust WACC, tax rates, revenue growth, and capital expenditures as needed.
- Real-Time Calculations: Automatically computes intrinsic value and NPV on-the-fly.
- Scenario Planning: Explore various scenarios to assess V-Mart's future performance.
- User-Friendly Interface: Designed for professionals, yet easy to navigate for newcomers.
Key Features
- Customizable Forecast Inputs: Adjust essential metrics such as sales growth, operating margin, and capital investments.
- Instant DCF Valuation: Quickly derives intrinsic value, NPV, and additional results with ease.
- High Precision Accuracy: Incorporates V-Mart Retail Limited’s actual financial data for dependable valuation results.
- Simplified Scenario Analysis: Effortlessly examine various assumptions and review results side by side.
- Efficiency Booster: Avoid the hassle of constructing detailed valuation models from the ground up.
How It Operates
- Step 1: Download the Excel file.
- Step 2: Examine V-Mart Retail Limited's pre-filled financial data and projections.
- Step 3: Adjust key inputs such as revenue growth, WACC, and tax rates (highlighted cells).
- Step 4: Observe the DCF model automatically update as you modify assumptions.
- Step 5: Review the outputs and leverage the results for your investment strategies.
Why Opt for This Calculator?
- Precision: Leveraging actual V-Mart Retail Limited (VMARTNS) financials for reliable data.
- Customization: Users can easily adjust and explore various inputs without restrictions.
- Efficiency: Eliminate the need to create a DCF model from the ground up.
- Expert-Quality: Crafted with the meticulousness expected at the CFO level.
- Intuitive Design: Simple to navigate, even for those new to financial modeling.
Who Can Benefit from This Product?
- Investors: Evaluate V-Mart Retail Limited’s (VMARTNS) market value before making investment decisions.
- CFOs and Financial Analysts: Optimize valuation methods and validate financial forecasts.
- Startup Founders: Understand how established retailers like V-Mart Retail Limited are assessed financially.
- Consultants: Provide comprehensive valuation reports tailored for client needs.
- Students and Educators: Utilize real-time data to practice and instruct on valuation strategies.
Overview of Template Components
- Operating and Balance Sheet Data: Pre-filled historical data and forecasts for V-Mart Retail Limited (VMARTNS), including revenue, EBITDA, EBIT, and capital expenditures.
- WACC Calculation: A dedicated section for calculating the Weighted Average Cost of Capital (WACC), featuring inputs such as Beta, risk-free rate, and share price.
- DCF Valuation (Unlevered and Levered): Customizable Discounted Cash Flow models that outline intrinsic value with comprehensive calculations.
- Financial Statements: Pre-loaded annual and quarterly financial statements to facilitate in-depth analysis.
- Key Ratios: Includes essential ratios for profitability, leverage, and efficiency specific to V-Mart Retail Limited (VMARTNS).
- Dashboard and Charts: A visual representation of valuation outputs and assumptions for straightforward results analysis.
Disclaimer
All information, articles, and product details provided on this website are for general informational and educational purposes only. We do not claim any ownership over, nor do we intend to infringe upon, any trademarks, copyrights, logos, brand names, or other intellectual property mentioned or depicted on this site. Such intellectual property remains the property of its respective owners, and any references here are made solely for identification or informational purposes, without implying any affiliation, endorsement, or partnership.
We make no representations or warranties, express or implied, regarding the accuracy, completeness, or suitability of any content or products presented. Nothing on this website should be construed as legal, tax, investment, financial, medical, or other professional advice. In addition, no part of this site—including articles or product references—constitutes a solicitation, recommendation, endorsement, advertisement, or offer to buy or sell any securities, franchises, or other financial instruments, particularly in jurisdictions where such activity would be unlawful.
All content is of a general nature and may not address the specific circumstances of any individual or entity. It is not a substitute for professional advice or services. Any actions you take based on the information provided here are strictly at your own risk. You accept full responsibility for any decisions or outcomes arising from your use of this website and agree to release us from any liability in connection with your use of, or reliance upon, the content or products found herein.