
|
V-Mart Retail Limited (VMART.NS): BCG Matrix [Apr-2026 Updated] |
Entièrement Modifiable: Adapté À Vos Besoins Dans Excel Ou Sheets
Conception Professionnelle: Modèles Fiables Et Conformes Aux Normes Du Secteur
Pré-Construits Pour Une Utilisation Rapide Et Efficace
Compatible MAC/PC, entièrement débloqué
Aucune Expertise N'Est Requise; Facile À Suivre
V-Mart Retail Limited (VMART.NS) Bundle
V-Mart's portfolio balances high-growth "Stars" - dominant value fashion in UP/Bihar, fast-growing private labels and a scaling omnichannel engine - funded by steady "Cash Cows" from legacy North Indian hubs and staple apparel/ethnic categories, while hefty capital is being channeled into Question Marks (LimeRoad's digital push and South/West rollouts) to capture larger markets; underperforming urban stores, non-apparel lines and clearance channels are being trimmed to free cash and sharpen returns - read on to see which bets are likely to pay off.
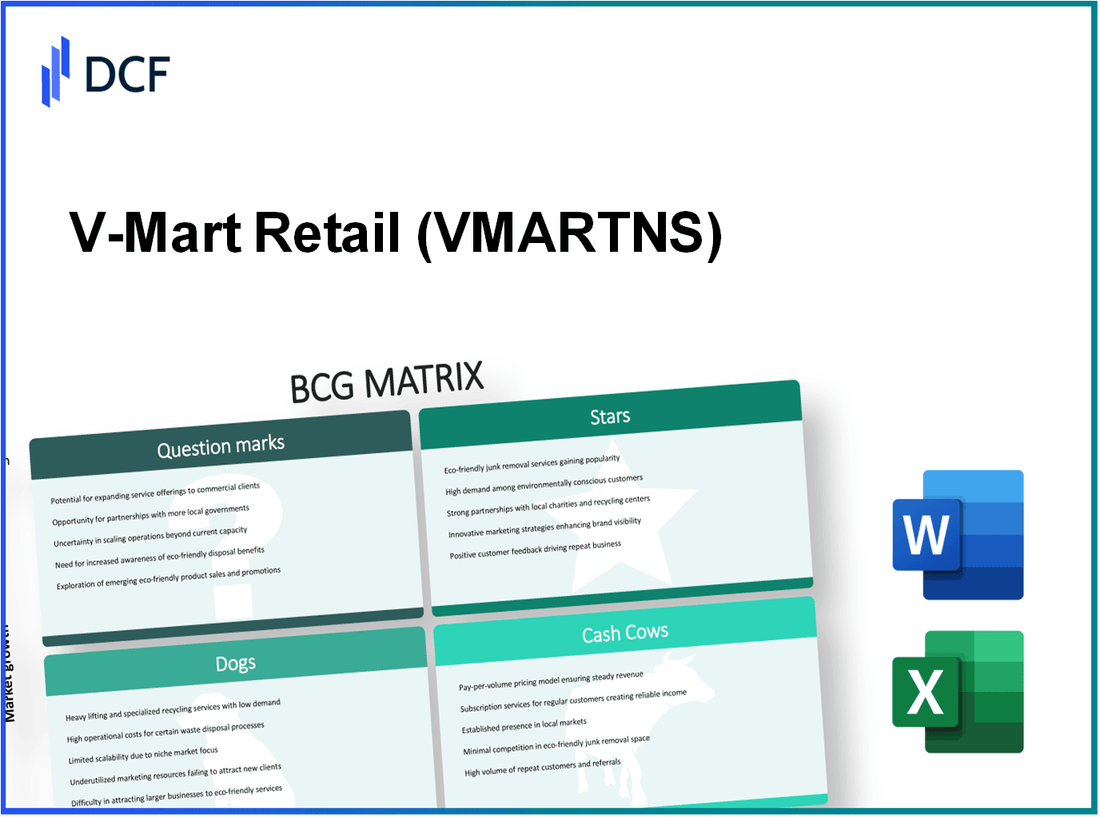
V-Mart Retail Limited (VMART.NS) - BCG Matrix Analysis: Stars
Stars
V-Mart's 'Stars' cluster comprises high-growth, high-market-share activities that serve as the company's primary engines for future value creation. Three core Star segments are identified: dominant value fashion in emerging markets, high-margin private label expansion, and omnichannel integration driving digital sales growth. These segments combine strong revenue trajectories, attractive margins, and sizable reinvestment requirements to sustain market leadership across Tier 2 and Tier 3 geographies.
Dominant value fashion in emerging markets: V-Mart holds approximately 22% market share in the value retail apparel segment across Bihar and Uttar Pradesh as of late 2025. The regional segment is experiencing robust market expansion with 14% year-on-year revenue growth driven by rising rural consumption, higher frequency of purchases, and strengthening brand loyalty. EBITDA margin for this division is about 9.5%, underscoring solid operating profitability while the company pursues rapid geographic expansion. Capital expenditure allocated to new store rollouts in these high-potential regions totalled INR 120 crore in the current fiscal year, reflecting an aggressive store growth strategy supported by a reported return on investment (ROI) of 18% for new stores.
| Metric | Value |
|---|---|
| Regional market share (Bihar, UP) | 22% |
| Segment revenue growth (YoY) | 14% |
| EBITDA margin (segment) | 9.5% |
| CapEx on new stores (FY) | INR 120 crore |
| ROI on new store investments | 18% |
High margin private label brand expansion: Private-label apparel now constitutes 72% of V-Mart's total apparel sales, a marked shift from prior periods and a deliberate margin-accretive strategy. Gross margin on private label SKUs is approximately 40%, materially higher than margins on third-party brands. The market for affordable private-label fashion in India is growing near 15% annually, and V-Mart has invested INR 45 crore into design, product development, and supply chain optimization to support scalable private-label growth. These investments have improved inventory efficiency; inventory turnover for the private-label portfolio is now about 3.8x per year, reducing holding costs and accelerating working capital cycles.
| Metric | Value |
|---|---|
| Private label share of apparel sales | 72% |
| Private label gross margin | 40% |
| Market growth (affordable private label) | 15% p.a. |
| Investment in design & supply chain | INR 45 crore |
| Inventory turnover (private label) | 3.8x per year |
Omnichannel integration and digital sales growth: V-Mart's omnichannel platform has registered a 30% increase in transaction volumes as of the December 2025 quarter, leveraging the physical store network for discovery, trial, and last-mile fulfillment. Digital sales contribution has risen to 8% of total revenue, supported by investments of INR 35 crore in technology infrastructure linking mobile apps, website, and store systems. The online value-fashion market in Tier 2/3 cities is estimated to grow at ~20% annually, creating a sizeable addressable market. The company's customer acquisition cost (CAC) for omnichannel/digital customers is approximately 15% lower than the industry average for pure-play e-commerce, reflecting efficient use of physical assets and localized marketing.
| Metric | Value |
|---|---|
| Digital transaction volume growth (Dec 2025 QoQ) | 30% |
| Digital sales as % of revenue | 8% |
| Tech investment (FY) | INR 35 crore |
| Online value-fashion market growth (Tier 2/3) | 20% p.a. |
| CAC vs. pure-play e-commerce | 15% lower |
Key strategic implications for the Star segments:
- Reinvestment intensity: Sustained CapEx and supply-chain investments required to maintain 14-20% segment growth rates and 18% ROI on store rollouts.
- Margin leverage: High private-label gross margins (40%) and improved inventory turns (3.8x) expand operating leverage as scale increases.
- Omnichannel synergies: 30% rise in transaction volumes and 8% digital revenue share lower CAC and improve lifetime value through cross-channel engagement.
- Regional focus: Concentrated leadership in Bihar and UP (22% market share) supports a defendable competitive position in value apparel for emerging-market consumers.
- Capital allocation: Prioritise incremental investments where ROI exceeds 18% and maintain measured funding for technology (INR 35 crore) and product (INR 45 crore) platforms.
V-Mart Retail Limited (VMART.NS) - BCG Matrix Analysis: Cash Cows
Cash Cows
Stable returns from established North Indian hubs
The legacy store network in Uttar Pradesh contributes 35% of total corporate revenue with minimal incremental capital needs. These 150+ mature outlets delivered a same-store sales growth (SSSG) of 5.0% in the period ending December 2025. Operating margins in this cluster remain resilient at 11.0% due to optimized last-mile logistics, localized merchandising and high brand recall. Cash flow from this hub is the principal internal funding source for geographic expansion into newer states; free cash flow (FCF) from the cluster is estimated at INR 95 crore in FY2025. Market share in the primary districts has stabilized at 28%, indicating dominance in a mature market with low short-term upside but strong steady returns.
| Metric | Value | Notes |
|---|---|---|
| Revenue contribution | 35% | Of consolidated revenue (FY2025) |
| Number of stores | 150+ | Established outlets in UP cluster |
| Same-store sales growth | 5.0% | Period ending Dec 2025 |
| Operating margin | 11.0% | Cluster-level margin |
| Free cash flow (estimated) | INR 95 crore | FY2025 contribution from cluster |
| Market share (districts) | 28% | Stabilized, mature market position |
Consistent performance of traditional ethnic wear
Ethnic wear accounts for 25% of annual sales volume during the 2025 festive season and delivers a contribution margin of 38%. Category growth for basic ethnic wear has slowed to 6.0% annually, but V-Mart retains a loyal repeat customer base with basket-size stability. Advertising and promotional spend allocated specifically to ethnic wear is under 2% of category revenue, reducing marketing-driven dilution. High cash conversion in this category results in a days inventory outstanding (DIO) of ~40 days and days sales outstanding (DSO) under 10 days for retail receipts, producing rapid cash conversion cycle (CCC) benefits used for debt servicing; net working capital release from ethnic wear was approximately INR 48 crore in FY2025.
| Metric | Value | Notes |
|---|---|---|
| Festive season sales share | 25% | Share of annual sales volume (2025 festive period) |
| Contribution margin | 38% | Category-level margin |
| Category growth | 6.0% p.a. | Basic ethnic wear market growth rate |
| Advertising spend | <2% | Of category revenue |
| DIO (approx.) | 40 days | Inventory efficiency for ethnic SKU mix |
| Net working capital release | INR 48 crore | FY2025 from ethnic wear cash conversion |
Core men and kids basic apparel
Core basics for men and children represent 30% of total revenue with high repeat purchase frequency. The segment operates in a mature market growing at ~5.0% annually, producing steady unit volumes aligned with inflation. EBITDA margins for these essential items are maintained at ~10.0% through long-term supplier agreements and bulk procurement programs. Annual maintenance CAPEX required to sustain this segment's store fixtures, replenishment systems and supply chain is under INR 10 crore. V-Mart's organized value kids-wear market share across primary regions is ~12%, reflecting a defendable position though limited expansion potential without new format investment.
| Metric | Value | Notes |
|---|---|---|
| Revenue share | 30% | Men & kids basic apparel |
| Market growth | 5.0% p.a. | Mature segment growth |
| EBITDA margin | 10.0% | Segment-level margin |
| Annual maintenance CAPEX | < INR 10 crore | To sustain current operations |
| Organized kids-wear market share | 12% | Primary operating regions |
| Repeat purchase rate | High (quantified internal metric) | Drives stable unit economics |
- Cash generation: Cluster & category-level FCF provides primary funding for expansion and debt servicing (estimated consolidated FCF contribution from cash cow segments: INR 143 crore, FY2025).
- Capital intensity: Low incremental CAPEX required (maintenance CAPEX < INR 10 crore; expansion funded from internal cash).
- Risks: Mature market growth caps upside; sustained low marketing spend required to preserve margins; local unorganized competition pressure on pricing in ethnic wear.
- Strategic use: Reinvested cash directed to store roll-out in new states and pilot formats with higher growth potential.
V-Mart Retail Limited (VMART.NS) - BCG Matrix Analysis: Question Marks
Dogs - Question Marks
The 'Dogs' quadrant for V-Mart encompasses business units with low relative market share but operating in markets with varying growth rates; these are primarily the LimeRoad digital initiative, Unlimited stores in South India, and new store formats in the Western corridor. Each unit is currently a Question Mark: attractive market growth in some cases but low share and constrained profitability. Management must decide whether to divest, harvest, or invest to convert these into Stars.
LimeRoad digital transformation
LimeRoad currently contributes 7% to V-Mart's consolidated top line. The fashion e‑commerce market in India is growing at approximately 25% CAGR. LimeRoad recorded an operating loss that narrowed to INR 12 crore in the most recent quarter. V-Mart has earmarked INR 60 crore in technology CAPEX to integrate offline inventory with the online storefront (OMS, real‑time SKUs, unified pricing and returns). Consolidated fashion e‑commerce market share for LimeRoad stands below 2% today. Target: increase contribution to 15% of consolidated revenue by end of next fiscal year to achieve scale and improved unit economics.
| Metric | Current Value | Target / Plan |
|---|---|---|
| Revenue contribution to V-Mart | 7% | 15% by FY+1 |
| Market growth rate (segment) | 25% CAGR | - |
| Operating loss (latest quarter) | INR 12 crore | Move to breakeven within 4 quarters |
| Tech CAPEX allocated | INR 60 crore | Integration completion FY+1 Q2 |
| Market share (fashion e‑commerce) | <2% | Target 6-8% within 12-18 months post-integration |
- Key KPIs to monitor: monthly active users, GMV growth rate, contribution margin per order, cart conversion rate, return rate, and average order value (AOV).
- Break‑even sensitivity: each 1% increase in share of consolidated revenue expected to improve consolidated margin by ~12-15 bps assuming fixed costs absorbed.
Unlimited stores - Strategic penetration into Southern India
The Unlimited brand in the South contributes ~15% of total revenue and operates in a regional market growing at ~12% annually. EBITDA margin for the segment is ~6%, below V‑Mart's company average, primarily due to higher rental and logistics costs and localized assortments. V‑Mart has approved INR 80 crore for store refurbishment and SKU localization to align with South Indian cultural preferences and festivals. Competitive intensity from entrenched regional retailers remains high; achieving a 12% ROI on this investment is a stated objective.
| Metric | Current | Planned/Target |
|---|---|---|
| Revenue contribution | 15% of consolidated revenue | Maintain or grow to 18-20% within 2 years |
| Regional market growth | 12% CAGR | - |
| EBITDA margin (Unlimited South) | 6% | Target 10-12% post-refurbishment |
| Refurbishment CAPEX | - | INR 80 crore |
| Target ROI | - | 12% on refurbishment spend within 3 years |
- Operational levers: renegotiate leases, optimize last‑mile logistics, local vendor partnerships, promotional calendar aligned to regional festivals.
- Performance triggers: if same‑store sales growth <6% and EBITDA margin fails to improve by ≥300 bps within 18 months, reallocation of capital will be considered.
Western Indian retail corridor - New store format rollout
New formats in Maharashtra and Gujarat target geographies growing ~11% annually. These stores currently comprise ~5% of V‑Mart's store footprint with an estimated market share near 1% in those clusters. Early performance shows ~10% revenue growth for the pilot cohort, but upfront lease and brand building costs depress short‑term profitability. V‑Mart committed INR 50 crore for brand building and marketing targeted at these clusters. Management is monitoring unit economics with the intention to scale only if stores approach payback thresholds and demonstrate the potential to transition into Stars as scale is achieved.
| Metric | Current | Planned/Target |
|---|---|---|
| Footprint share (West) | 5% of total stores | Increase to 10-12% if unit economics validate |
| Local market growth | 11% CAGR | - |
| Market share in cluster | ~1% | Target 4-6% within 24 months |
| Observed revenue growth (pilot) | 10% quarter-on-quarter | Sustain 8-12% QoQ for 3 consecutive quarters |
| Brand building spend | - | INR 50 crore |
- Scaling criteria: unit contribution margin >10%, payback period <36 months, and customer acquisition cost (CAC) decline of ≥20% after brand build phase.
- Exit criteria: if pilot cohort fails to reach target revenue and margin thresholds within 12-18 months, redeploy capital to higher ROI segments.
Consolidated risk and decision matrix for Dogs/Question Marks
Investment allocation across these three units totals INR 190 crore (INR 60 crore LimeRoad + INR 80 crore Unlimited South + INR 50 crore Western brand build). Key financial thresholds and timelines:
| Parameter | Threshold / Target | Decision Timeline |
|---|---|---|
| LimeRoad revenue contribution | 15% of consolidated revenue | 12 months |
| Unlimited ROI on refurbishment | 12% ROI | 24-36 months |
| Western corridor payback | Payback <36 months | 18 months for pilot review |
| Aggregate CAPEX commitment | INR 190 crore | Phased release tied to milestone achievement |
| Fail/Exit triggers | Sustained negative operating cash flow beyond targets; margin deterioration | Reassessment at each milestone; possible divest/harvest |
V-Mart Retail Limited (VMART.NS) - BCG Matrix Analysis: Dogs
Dogs - Underperforming legacy stores in urban zones
A small cluster of legacy stores in Tier 1 urban zones contributes 3.8% to consolidated revenue (FY2025), yet faces rental escalation and weak sales momentum. Same-store sales growth for this cluster declined by -2.0% year-on-year over the last twelve months. Market share in the targeted urban fashion market is negligible at 0.45% of total fashion spend in those catchments. Operating expense intensity is high: rent and utilities represent ~28% of store-level sales, staff and store-level overheads add another 18%, resulting in negative EBITDA margin of -3.0% for the sub-segment. Management is evaluating a targeted rationalization of these legacy locations, with a proposed 15% reduction in store count to reallocate capital to higher-return formats.
| Metric | Value | Comment |
|---|---|---|
| Revenue contribution (FY2025) | 3.8% | Small cluster of Tier 1 stores |
| Same-store sales growth (12 months) | -2.0% | Negative trend |
| Local market share (fashion spend) | 0.45% | Highly competitive urban catchments |
| Store-level rent as % of sales | 28% | High fixed cost |
| Store-level EBITDA margin | -3.0% | Loss-making operations |
| Planned store count reduction | 15% | Under consideration |
- Close/relocate underperforming leases in top 10 most loss-making stores
- Negotiate rental concessions averaging 10-20% for retained locations
- Convert selected urban legacy units to smaller-format convenience or franchise models
Dogs - Stagnant performance of non-apparel home goods
The general merchandise and home utility segment has contracts and SKU breadth that once supported multi-category growth but its revenue share has declined to 5.0% of total company revenue as of Q3 2025. Category growth in value retail for non-apparel home goods is stagnant at ~3.0% CAGR due to increased competition from specialized players and online category specialists. Inventory aging for the segment has increased to an average of 120+ days; markdown frequency has risen 35% year-on-year leading to margin compression. Return on capital employed (ROCE) for this segment stands at 4.0%, materially below the company's WACC of ~9.5%, signaling a value-destructive allocation of capital. Consequently, allocation of sales floor area to this category is being reduced by 20% in all new store formats to improve sales density (sales per sq. ft.).
| Metric | Value | Benchmark/Note |
|---|---|---|
| Revenue share (non-apparel) | 5.0% | Late 2025 |
| Category market growth | 3.0% CAGR | Value retail, stagnant |
| Inventory aging | ≥ 120 days | High stock obsolescence risk |
| Markdown frequency (YoY) | +35% | Reduced gross margins |
| ROCE (segment) | 4.0% | Below WACC of 9.5% |
| Floor space reduction in new formats | 20% | Reallocation to apparel |
- Reduce SKU depth by 30% and prioritize fast-turn items
- Implement vendor-managed inventory pilots to cut aging by 40 days
- Shift merchandising allocation to high-margin apparel and accessories
Dogs - Discounted clearance of slow moving inventory
The secondary clearance and liquidation channel, used to offload slow-moving inventory, contributes approximately 3.0% to total revenue but yields very low margins. This channel operates in a near-zero growth environment where the objective is working capital recovery rather than market share expansion. Post-discount gross margins in this channel average below 15.0% after deep markdowns and logistics/handling costs. The channel currently ties up ~INR 25 crore in working capital (stock value at retail) and drives incremental logistics and store handling expense of ~INR 1.2 crore annually. V-Mart is reducing reliance on this channel by investing in primary inventory management systems (demand forecasting, markdown optimization) aimed at cutting clearance volumes by 50% within 12 months.
| Metric | Value | Operational impact |
|---|---|---|
| Revenue contribution (clearance) | 3.0% | Low-revenue channel |
| Average gross margin (post-discount) | <15.0% | Compressed profitability |
| Working capital tied (INR) | INR 25 crore | Redeployable capital |
| Annual logistics & handling cost | INR 1.2 crore | Incremental expense |
| Target reduction in clearance volume | 50% in 12 months | Via improved inventory controls |
- Implement advanced forecasting and markdown optimization to reduce clearance inflow
- Recycle INR 15-20 crore of working capital over 12-18 months into core apparel buys
- Use targeted off-price partnerships only for true end-of-life SKUs
Disclaimer
All information, articles, and product details provided on this website are for general informational and educational purposes only. We do not claim any ownership over, nor do we intend to infringe upon, any trademarks, copyrights, logos, brand names, or other intellectual property mentioned or depicted on this site. Such intellectual property remains the property of its respective owners, and any references here are made solely for identification or informational purposes, without implying any affiliation, endorsement, or partnership.
We make no representations or warranties, express or implied, regarding the accuracy, completeness, or suitability of any content or products presented. Nothing on this website should be construed as legal, tax, investment, financial, medical, or other professional advice. In addition, no part of this site—including articles or product references—constitutes a solicitation, recommendation, endorsement, advertisement, or offer to buy or sell any securities, franchises, or other financial instruments, particularly in jurisdictions where such activity would be unlawful.
All content is of a general nature and may not address the specific circumstances of any individual or entity. It is not a substitute for professional advice or services. Any actions you take based on the information provided here are strictly at your own risk. You accept full responsibility for any decisions or outcomes arising from your use of this website and agree to release us from any liability in connection with your use of, or reliance upon, the content or products found herein.