
|
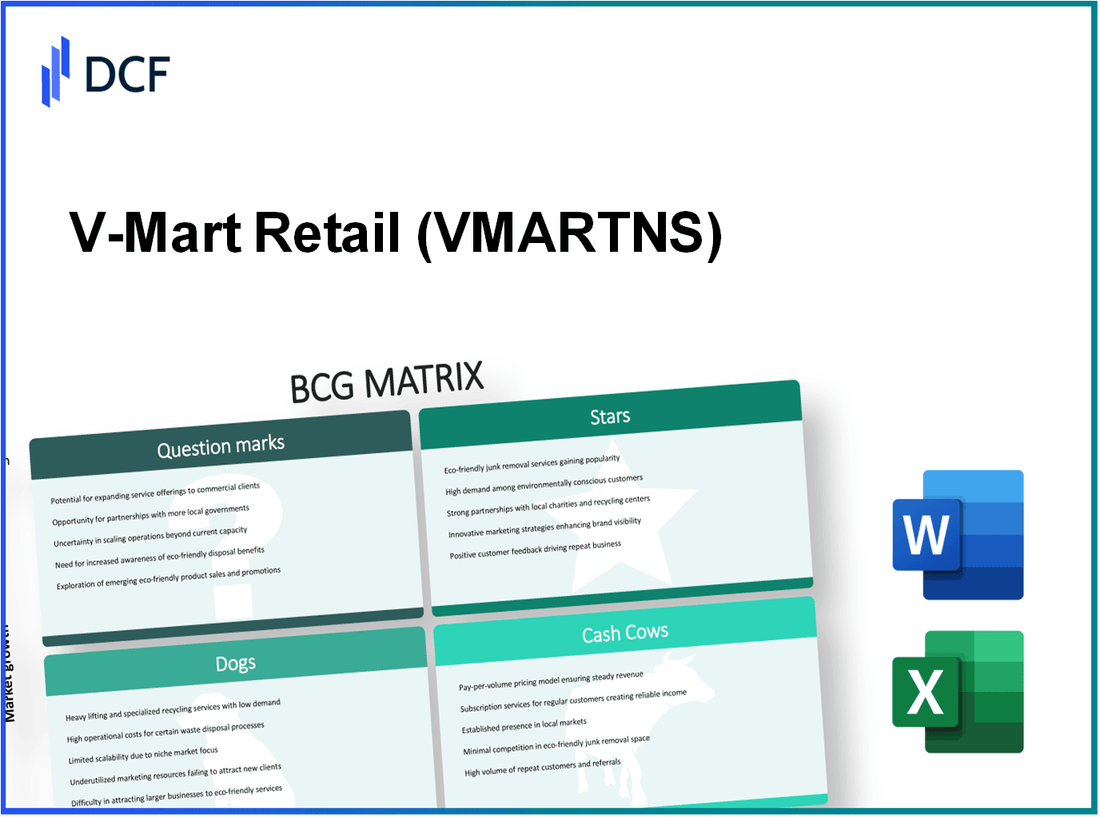
V-Mart Retail Limited (VMART.NS): BCG Matrix |
Fully Editable: Tailor To Your Needs In Excel Or Sheets
Professional Design: Trusted, Industry-Standard Templates
Investor-Approved Valuation Models
MAC/PC Compatible, Fully Unlocked
No Expertise Is Needed; Easy To Follow
V-Mart Retail Limited (VMART.NS) Bundle
In the dynamic world of retail, understanding where a company stands in terms of market performance is crucial for strategic decision-making. V-Mart Retail Limited, a key player in the Indian retail landscape, presents a fascinating case through the lens of the Boston Consulting Group (BCG) Matrix. From its promising Stars that shine brightly in online sales growth to the challenges faced by its Dogs, there’s much to unpack. Dive deeper to discover how V-Mart is navigating its market position with Cash Cows and Question Marks driving its future strategy.
Background of V-Mart Retail Limited
V-Mart Retail Limited, established in 2002, operates as a prominent retail chain in India. The company specializes in affordable clothing and accessories, catering primarily to the value segment. With its headquarters in Noida, Uttar Pradesh, V-Mart has expanded its footprint significantly across India, with over 300 stores in more than 200 cities as of October 2023.
The brand positions itself in the mid-price segment, providing a wide range of apparel, including traditional wear, casual wear, and western outfits. Its offerings also encompass home décor and accessories, aimed at meeting various customer needs. V-Mart's strategy focuses on delivering quality products at competitive prices, making fashion accessible to the larger population.
In the fiscal year 2022-2023, V-Mart reported a revenue of approximately ₹1,000 crores, reflecting a growth trajectory that aligns with its expansion goals. The company's emphasis on an efficient supply chain, coupled with strong vendor relationships, contributes to its operational efficiency and cost management.
The retail landscape in India has witnessed dynamic shifts, particularly post-pandemic. V-Mart has adapted by integrating omnichannel strategies, enhancing its e-commerce platform alongside brick-and-mortar stores. This adaptability has positioned V-Mart favorably amid evolving consumer preferences.
Moreover, V-Mart's focus on tier-2 and tier-3 cities has proven advantageous, tapping into the burgeoning middle class. As consumer spending in these segments rises, V-Mart remains committed to expanding its reach, ensuring that quality apparel remains within the financial grasp of this demographic.
V-Mart Retail Limited - BCG Matrix: Stars
V-Mart Retail Limited has successfully positioned certain business units as Stars within its portfolio. These units exhibit high market share in a rapidly growing retail sector, particularly in tier-2 and tier-3 cities across India. As of FY2023, the company reported a market share of approximately 7.5% in the organized retail sector.
The online sales segment has seen strong growth, contributing significantly to V-Mart's overall revenue. For the first quarter of FY2024, online sales surged by 45% year-over-year, highlighting consumer preference shifts towards e-commerce. The contribution of online sales to total revenue increased from 10% in FY2022 to 15% in FY2023.
Strong Online Sales Growth
This growth can be attributed to several strategic initiatives, including partnerships with major e-commerce platforms and enhancement of their own digital interfaces. For instance, in Q3 FY2023, V-Mart reported total online transactions reaching 200,000, up from 120,000 in the same quarter of the previous year.
Expanding Geographic Footprint
V-Mart has also been successful in expanding its geographic footprint. The company operated 330 stores as of March 2023, with plans to open an additional 50 stores by the end of FY2024. This expansion effort targets emerging markets, particularly in northern India, where consumer demand is growing robustly.
| Metric | FY2022 | FY2023 | Target FY2024 |
|---|---|---|---|
| Total Stores | 300 | 330 | 380 |
| Online Sales Growth | 10% | 15% | 25% (Target) |
| Geographical Reach | 15 States | 18 States | 20 States (Target) |
Rapidly Increasing Customer Loyalty Programs
Moreover, V-Mart has been significantly investing in customer loyalty programs. As of March 2023, the loyalty program had approximately 1.5 million members, representing a growth of 60% year-over-year. The program’s contribution to sales is estimated at 30% of total store revenue. The company frequently runs promotions that encourage retention and repeat purchases, which are critical in a high-growth environment.
In Q1 FY2024, V-Mart reported that loyalty program members had an average transaction value of ₹1,500, compared to ₹1,000 for non-members. This disparity emphasizes the effectiveness of loyalty initiatives in boosting sales and enhancing customer engagement.
V-Mart Retail Limited - BCG Matrix: Cash Cows
V-Mart Retail Limited showcases several attributes of Cash Cows within its business model, characterized by high market share in a mature market along with robust cash flow generation. The following outlines the key components.
High-performing city stores
V-Mart's city stores are strategically located and have consistently reported strong sales performance. As of the latest fiscal year, the company recorded a revenue growth of 15% in urban locations, capitalizing on high foot traffic and demand for retail shopping experiences. The average store contributes approximately ₹3 crore annually in sales, with a net profit margin of around 8%.
Established apparel lines
The apparel segment stands as a significant Cash Cow for V-Mart, with well-established brands that cater to a wide customer base. In the last reported quarter, V-Mart's apparel lines generated ₹400 crore in sales, accounting for over 50% of the total revenue. With a stable growth rate of just 5% due to market saturation, these products deliver average gross margins of approximately 40%.
Efficient supply chain management
V-Mart's efficient supply chain management is essential for maintaining its Cash Cow status. The company has achieved a reduction in inventory holding costs by 20%, facilitating better cash flow. Furthermore, the average days sales of inventory (DSI) stands at 30 days, enabling quicker product turnover and reduced waste. This efficiency allows V-Mart to reinvest the surplus cash generated into enhancing other business areas.
| Category | Key Metrics | Value |
|---|---|---|
| High-performing city stores | Annual Sales Contribution | ₹3 crore per store |
| Revenue Growth | 15% | |
| Established apparel lines | Sales Generated | ₹400 crore |
| Gross Margin | 40% | |
| Market Share Contribution | 50% | |
| Efficient supply chain management | Reduction in Inventory Costs | 20% |
| Average Days Sales of Inventory (DSI) | 30 days |
V-Mart Retail Limited - BCG Matrix: Dogs
V-Mart Retail Limited has several business units categorized as Dogs, which are characterized by low market share and low growth rates. These units struggle to generate significant cash flow and often consume resources that could be deployed more effectively elsewhere.
Underperforming Rural Locations
Throughout 2021, V-Mart expanded its presence into rural markets, but certain locations failed to gain traction. The company reported closures in 15 rural stores by mid-2023. The average footfall in these locations was only 120 customers per day, significantly below the company’s targeted 250 customers per day. The decline in revenue from these stores amounted to approximately INR 50 million annually, leading to considerations for divestiture.
Declining Electronics Segment
V-Mart's electronics segment has seen a downturn, with sales dipping by 20% year-over-year as of Q3 2023. The market share in the electronics category dropped from 5% to 3% over the last two years. Inventory turnover for electronics stood at 4 times per year, indicating sluggish sales and potential write-offs amounting to INR 30 million in unsold stock in 2022.
| Year | Sales (INR million) | Market Share (%) | Inventory Turnover (times/year) |
|---|---|---|---|
| 2021 | 150 | 5 | 5 |
| 2022 | 120 | 4 | 4.5 |
| 2023 | 90 | 3 | 4 |
Outdated Legacy Systems
V-Mart has faced challenges with outdated legacy systems that hinder operational efficiency. The company reported IT maintenance costs of INR 70 million in 2022, which showed a 15% increase over the previous year. These systems result in a lag in data processing, leading to missed opportunities in inventory management and customer engagement. The operational inefficiencies attributed to these legacy systems are estimated to have cost the company nearly INR 40 million in lost sales opportunities during Q4 2022.
The burden of these legacy systems also affects employee productivity, with an average downtime reported at 25 hours per month across various departments, leading to potential losses in labor productivity. This segment is seen as a liability within the Dogs category due to the significant costs and minimal returns.
V-Mart Retail Limited - BCG Matrix: Question Marks
Within V-Mart Retail Limited, certain products aligned as Question Marks reflect significant potential yet present challenges due to their low market share in a rapidly growing market. These offerings often entail new private label products that have entered the market but are still in the process of gaining traction with consumers.
New Private Label Products
V-Mart has introduced several private label products, focusing on its clothing and home essentials range. For instance, in FY2023, the contribution of private label products to total revenue stood at approximately 20%. Despite being new entrants, these products are positioned in a market that has seen growth rates of around 15% annually. However, the market share for these private labels remains low, estimated at about 5% of the total apparel segment, indicating the need for strategic marketing investments to increase visibility and consumer adoption.
Emerging Digital Marketing Strategies
V-Mart is increasingly leveraging digital marketing strategies to drive awareness and sales of its Question Mark products. In Q1 2023, the company reported a 30% increase in online engagement through its digital campaigns. The conversion rate from these campaigns was noted at 2.5%, which is considered modest but reflects growth potential. Investment in digital marketing accounted for roughly 10% of the total marketing budget, amounting to approximately INR 10 million, underscoring the commitment to enhancing market share.
Uncertain International Expansion Plans
V-Mart’s ambitions for international expansion hit a crossroads, particularly regarding its Question Mark products. The company has been exploring entry into neighboring markets, with plans to penetrate the Bangladeshi market where retail is expected to grow by 12% in the next five years. Initial investment projections for these international forays were estimated at INR 50 million, but market analysis revealed uncertainties, leading to a reconsideration of timelines and strategies.
| Metric | Current Status | Growth Rate | Investment (FY2023) |
|---|---|---|---|
| Private Label Revenue Contribution | 20% | 15% CAGR | INR 10 million in marketing |
| Market Share of Private Labels | 5% | Low | Additional INR 50 million projected for market penetration |
| Digital Marketing Engagement Increase | 30% | Year-on-Year | INR 10 million allocated |
| Conversion Rate from Digital Marketing | 2.5% | Modest Growth | N/A |
The Question Marks of V-Mart Retail Limited highlight the dual challenge of managing high growth potential alongside the reality of low market share. The balance between investment in marketing, the push for private label adoption, and navigating international expansion remains crucial for transforming these Question Marks into Stars.
In analyzing V-Mart Retail Limited through the lens of the BCG Matrix, we see distinct categories reflecting the company's diverse portfolio—ranging from Stars with robust online growth to Cash Cows that thrive in urban settings, while Dogs highlight challenges in rural areas, and Question Marks represent uncertain opportunities that could redefine its future. This strategic segmentation not only aids in understanding current performance but also paves the way for informed decision-making moving forward.
[right_small]Disclaimer
All information, articles, and product details provided on this website are for general informational and educational purposes only. We do not claim any ownership over, nor do we intend to infringe upon, any trademarks, copyrights, logos, brand names, or other intellectual property mentioned or depicted on this site. Such intellectual property remains the property of its respective owners, and any references here are made solely for identification or informational purposes, without implying any affiliation, endorsement, or partnership.
We make no representations or warranties, express or implied, regarding the accuracy, completeness, or suitability of any content or products presented. Nothing on this website should be construed as legal, tax, investment, financial, medical, or other professional advice. In addition, no part of this site—including articles or product references—constitutes a solicitation, recommendation, endorsement, advertisement, or offer to buy or sell any securities, franchises, or other financial instruments, particularly in jurisdictions where such activity would be unlawful.
All content is of a general nature and may not address the specific circumstances of any individual or entity. It is not a substitute for professional advice or services. Any actions you take based on the information provided here are strictly at your own risk. You accept full responsibility for any decisions or outcomes arising from your use of this website and agree to release us from any liability in connection with your use of, or reliance upon, the content or products found herein.