
|
WOLTERS KLUWER N.V. (WKL.AS) Évaluation DCF |
Entièrement Modifiable: Adapté À Vos Besoins Dans Excel Ou Sheets
Conception Professionnelle: Modèles Fiables Et Conformes Aux Normes Du Secteur
Pré-Construits Pour Une Utilisation Rapide Et Efficace
Compatible MAC/PC, entièrement débloqué
Aucune Expertise N'Est Requise; Facile À Suivre
Wolters Kluwer N.V. (WKL.AS) Bundle
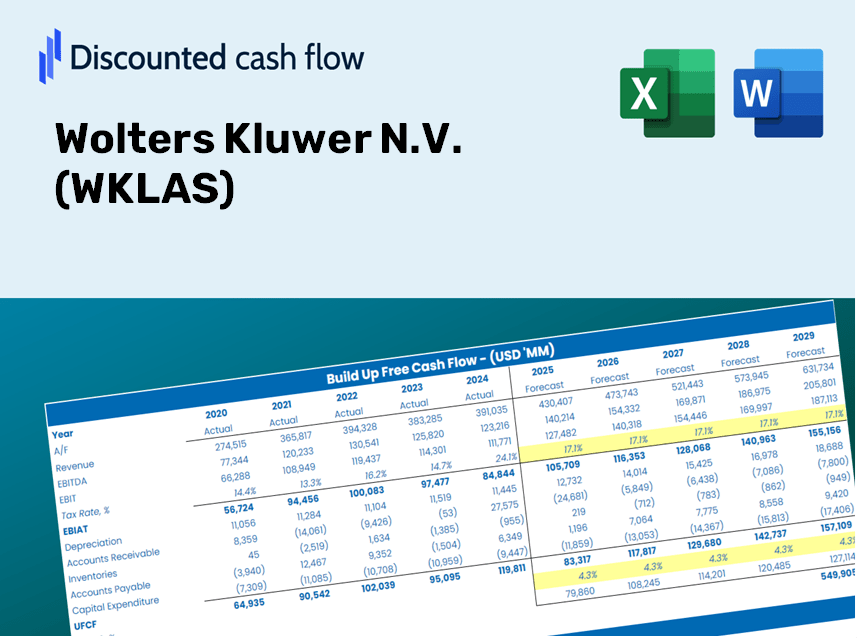
Vous cherchez à déterminer la valeur intrinsèque de Wolters Kluwer n.v.? Notre calculatrice (WKLAS) DCF intègre des données réelles avec des fonctionnalités de personnalisation approfondies, vous permettant d'affiner vos prévisions et de faire des choix d'investissement plus éclairés.
Discounted Cash Flow (DCF) - (USD MM)
| Year | AY1 2020 |
AY2 2021 |
AY3 2022 |
AY4 2023 |
AY5 2024 |
FY1 2025 |
FY2 2026 |
FY3 2027 |
FY4 2028 |
FY5 2029 |
|---|---|---|---|---|---|---|---|---|---|---|
| Revenue | 4,603.0 | 4,771.0 | 5,453.0 | 5,584.0 | 5,916.0 | 6,304.9 | 6,719.3 | 7,161.0 | 7,631.7 | 8,133.3 |
| Revenue Growth, % | 0 | 3.65 | 14.29 | 2.4 | 5.95 | 6.57 | 6.57 | 6.57 | 6.57 | 6.57 |
| EBITDA | 1,431.0 | 1,414.0 | 1,777.0 | 1,775.0 | 1,931.0 | 1,989.1 | 2,119.8 | 2,259.2 | 2,407.6 | 2,565.9 |
| EBITDA, % | 31.09 | 29.64 | 32.59 | 31.79 | 32.64 | 31.55 | 31.55 | 31.55 | 31.55 | 31.55 |
| Depreciation | 423.0 | 421.0 | 432.0 | 445.0 | 479.0 | 529.6 | 564.4 | 601.5 | 641.1 | 683.2 |
| Depreciation, % | 9.19 | 8.82 | 7.92 | 7.97 | 8.1 | 8.4 | 8.4 | 8.4 | 8.4 | 8.4 |
| EBIT | 1,008.0 | 993.0 | 1,345.0 | 1,330.0 | 1,452.0 | 1,459.4 | 1,555.4 | 1,657.6 | 1,766.6 | 1,882.7 |
| EBIT, % | 21.9 | 20.81 | 24.67 | 23.82 | 24.54 | 23.15 | 23.15 | 23.15 | 23.15 | 23.15 |
| Total Cash | 723.0 | 1,001.0 | 1,346.0 | 1,135.0 | 954.0 | 1,233.5 | 1,314.6 | 1,401.0 | 1,493.1 | 1,591.3 |
| Total Cash, percent | .0 | .0 | .0 | .0 | .0 | .0 | .0 | .0 | .0 | .0 |
| Account Receivables | 1,135.0 | 1,180.0 | 1,259.0 | 1,247.0 | 1,542.0 | 1,524.2 | 1,624.4 | 1,731.2 | 1,845.0 | 1,966.2 |
| Account Receivables, % | 24.66 | 24.73 | 23.09 | 22.33 | 26.06 | 24.18 | 24.18 | 24.18 | 24.18 | 24.18 |
| Inventories | 68.0 | 65.0 | 79.0 | 84.0 | 79.0 | 89.9 | 95.8 | 102.1 | 108.8 | 115.9 |
| Inventories, % | 1.48 | 1.36 | 1.45 | 1.5 | 1.34 | 1.43 | 1.43 | 1.43 | 1.43 | 1.43 |
| Accounts Payable | 133.0 | 123.0 | 147.0 | 37.0 | 159.0 | 145.2 | 154.7 | 164.9 | 175.7 | 187.3 |
| Accounts Payable, % | 2.89 | 2.58 | 2.7 | 0.66261 | 2.69 | 2.3 | 2.3 | 2.3 | 2.3 | 2.3 |
| Capital Expenditure | -238.0 | -240.0 | -295.0 | -323.0 | -313.0 | -336.5 | -358.6 | -382.2 | -407.3 | -434.1 |
| Capital Expenditure, % | -5.17 | -5.03 | -5.41 | -5.78 | -5.29 | -5.34 | -5.34 | -5.34 | -5.34 | -5.34 |
| Tax Rate, % | 21.7 | 21.7 | 21.7 | 21.7 | 21.7 | 21.7 | 21.7 | 21.7 | 21.7 | 21.7 |
| EBITAT | 780.6 | 779.0 | 1,082.5 | 1,032.6 | 1,136.9 | 1,145.1 | 1,220.4 | 1,300.6 | 1,386.1 | 1,477.2 |
| Depreciation | ||||||||||
| Changes in Account Receivables | ||||||||||
| Changes in Inventories | ||||||||||
| Changes in Accounts Payable | ||||||||||
| Capital Expenditure | ||||||||||
| UFCF | -104.4 | 908.0 | 1,150.5 | 1,051.6 | 1,134.9 | 1,331.4 | 1,329.7 | 1,417.1 | 1,510.2 | 1,609.5 |
| WACC, % | 4.57 | 4.57 | 4.58 | 4.57 | 4.57 | 4.57 | 4.57 | 4.57 | 4.57 | 4.57 |
| PV UFCF | ||||||||||
| SUM PV UFCF | 6,278.5 | |||||||||
| Long Term Growth Rate, % | 2.00 | |||||||||
| Free cash flow (T + 1) | 1,642 | |||||||||
| Terminal Value | 63,843 | |||||||||
| Present Terminal Value | 51,056 | |||||||||
| Enterprise Value | 57,335 | |||||||||
| Net Debt | 3,114 | |||||||||
| Equity Value | 54,221 | |||||||||
| Diluted Shares Outstanding, MM | 238 | |||||||||
| Equity Value Per Share | 227.44 |
What You Will Receive
- Authentic Wolters Kluwer Data: Comprehensive financials – from revenue to EBIT – based on actual and projected figures.
- Complete Customization: Modify all key parameters (yellow cells) such as WACC, growth %, and tax rates.
- Real-Time Valuation Updates: Automatic recalculations to assess the impact of changes on Wolters Kluwer’s fair value.
- Flexible Excel Template: Designed for easy modifications, scenario analysis, and thorough projections.
- Efficient and Precise: Eliminate the need to build models from the ground up while ensuring accuracy and adaptability.
Key Features
- Comprehensive Financial Data: Gain access to reliable, pre-loaded historical information and future forecasts for Wolters Kluwer N.V. (WKLAS).
- Customizable Assumptions: Modify highlighted cells such as WACC, growth rates, and margins to tailor your analysis.
- Automated Calculations: Enjoy seamless updates to DCF, Net Present Value (NPV), and cash flow assessments.
- Interactive Dashboard: Utilize clear charts and summaries to effectively visualize your valuation insights.
- Designed for All Users: An intuitive layout catered to investors, CFOs, and consultants, making it suitable for both experts and novices.
How It Functions
- Step 1: Download the Excel spreadsheet.
- Step 2: Examine Wolters Kluwer’s pre-filled financial metrics and projections.
- Step 3: Adjust key variables such as revenue growth, WACC, and tax rates (highlighted cells).
- Step 4: Observe the DCF model refresh in real-time as you modify your assumptions.
- Step 5: Evaluate the results and apply them to inform your investment strategies.
Why Choose This Calculator for Wolters Kluwer N.V. (WKLAS)?
- Reliable Data: Accurate financials from Wolters Kluwer guarantee dependable valuation outcomes.
- Tailored Options: Modify essential inputs such as growth rates, WACC, and tax rates to fit your forecasts.
- Efficiency Boost: Built-in calculations save you the hassle of starting from the ground up.
- Professional-Quality Tool: Crafted for investors, analysts, and consultants focusing on Wolters Kluwer.
- User-Friendly Interface: A straightforward design and clear instructions ensure accessibility for all users.
Who Should Benefit from Wolters Kluwer N.V. (WKLAS)?
- Finance Students: Master advanced financial analysis techniques using real-world case studies.
- Academics: Integrate professional-grade financial models into your teaching and research initiatives.
- Investors: Evaluate your investment strategies and assess valuation metrics specific to Wolters Kluwer N.V. (WKLAS).
- Analysts: Enhance your productivity with customizable financial models tailored to Wolters Kluwer N.V. (WKLAS).
- Small Business Owners: Understand the methodologies used to analyze large companies like Wolters Kluwer N.V. (WKLAS).
Contents of the Template
- In-Depth DCF Model: Editable template featuring comprehensive valuation calculations.
- Real-World Data: Wolters Kluwer N.V.'s (WKLAS) historical and projected financial figures preloaded for analysis.
- Adjustable Parameters: Modify WACC, growth rates, and tax assumptions to explore different scenarios.
- Financial Statements: Complete annual and quarterly breakdowns for enhanced insights.
- Essential Ratios: Integrated analysis for profitability, efficiency, and leverage metrics.
- Dashboard with Visual Outputs: Charts and tables that present clear, actionable results.
Disclaimer
All information, articles, and product details provided on this website are for general informational and educational purposes only. We do not claim any ownership over, nor do we intend to infringe upon, any trademarks, copyrights, logos, brand names, or other intellectual property mentioned or depicted on this site. Such intellectual property remains the property of its respective owners, and any references here are made solely for identification or informational purposes, without implying any affiliation, endorsement, or partnership.
We make no representations or warranties, express or implied, regarding the accuracy, completeness, or suitability of any content or products presented. Nothing on this website should be construed as legal, tax, investment, financial, medical, or other professional advice. In addition, no part of this site—including articles or product references—constitutes a solicitation, recommendation, endorsement, advertisement, or offer to buy or sell any securities, franchises, or other financial instruments, particularly in jurisdictions where such activity would be unlawful.
All content is of a general nature and may not address the specific circumstances of any individual or entity. It is not a substitute for professional advice or services. Any actions you take based on the information provided here are strictly at your own risk. You accept full responsibility for any decisions or outcomes arising from your use of this website and agree to release us from any liability in connection with your use of, or reliance upon, the content or products found herein.