
|
Walmart Inc. (WMT) Évaluation DCF |
Entièrement Modifiable: Adapté À Vos Besoins Dans Excel Ou Sheets
Conception Professionnelle: Modèles Fiables Et Conformes Aux Normes Du Secteur
Pré-Construits Pour Une Utilisation Rapide Et Efficace
Compatible MAC/PC, entièrement débloqué
Aucune Expertise N'Est Requise; Facile À Suivre
Walmart Inc. (WMT) Bundle
Évaluez les perspectives financières de Walmart Inc. (WMT) comme un expert! Cette calculatrice DCF (WMT) fournit des données financières pré-remplies et une flexibilité complète pour modifier la croissance des revenus, le WACC, les marges et d'autres hypothèses essentielles pour s'aligner sur vos projections.
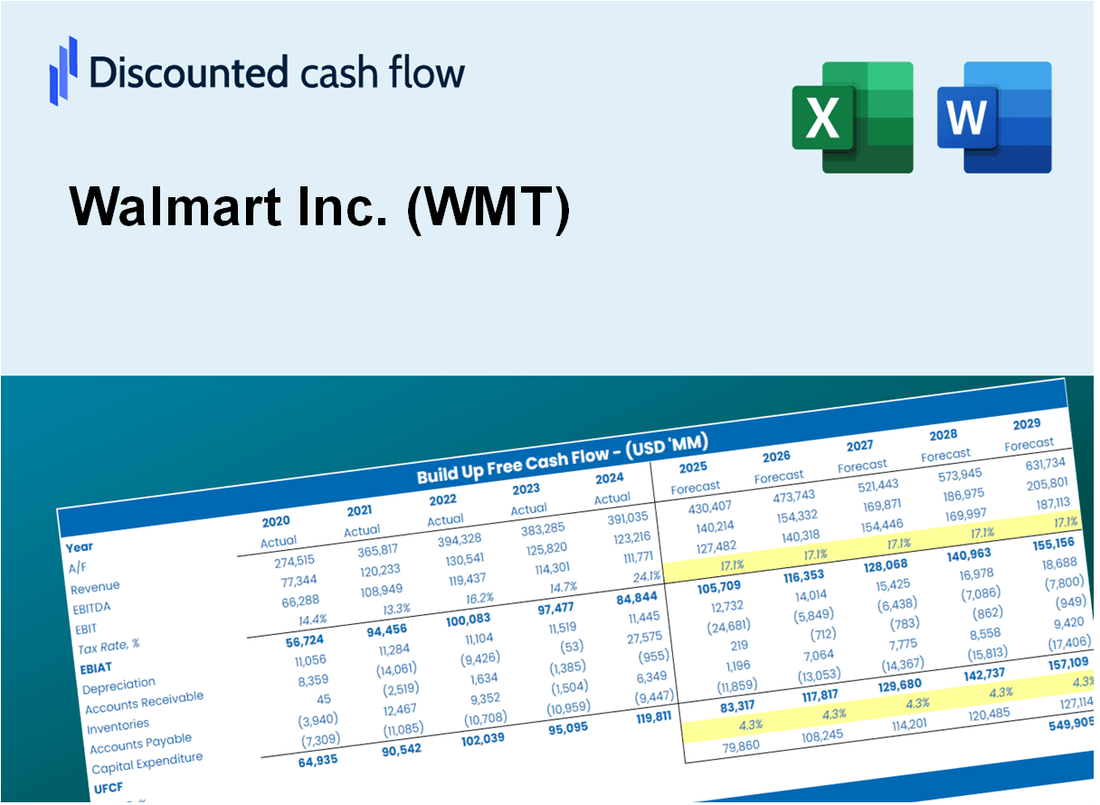
Discounted Cash Flow (DCF) - (USD MM)
| Year | AY1 2021 |
AY2 2022 |
AY3 2023 |
AY4 2024 |
AY5 2025 |
FY1 2026 |
FY2 2027 |
FY3 2028 |
FY4 2029 |
FY5 2030 |
|---|---|---|---|---|---|---|---|---|---|---|
| Revenue | 559,151.0 | 572,754.0 | 611,289.0 | 648,125.0 | 680,985.0 | 715,471.4 | 751,704.3 | 789,772.0 | 829,767.6 | 871,788.7 |
| Revenue Growth, % | 0 | 2.43 | 6.73 | 6.03 | 5.07 | 5.06 | 5.06 | 5.06 | 5.06 | 5.06 |
| EBITDA | 34,031.0 | 31,348.0 | 30,089.0 | 36,384.0 | 42,010.0 | 40,444.7 | 42,492.9 | 44,644.8 | 46,905.7 | 49,281.1 |
| EBITDA, % | 6.09 | 5.47 | 4.92 | 5.61 | 6.17 | 5.65 | 5.65 | 5.65 | 5.65 | 5.65 |
| Depreciation | 11,152.0 | 10,658.0 | 10,945.0 | 11,853.0 | 12,973.0 | 13,421.7 | 14,101.4 | 14,815.5 | 15,565.8 | 16,354.1 |
| Depreciation, % | 1.99 | 1.86 | 1.79 | 1.83 | 1.91 | 1.88 | 1.88 | 1.88 | 1.88 | 1.88 |
| EBIT | 22,879.0 | 20,690.0 | 19,144.0 | 24,531.0 | 29,037.0 | 27,023.0 | 28,391.5 | 29,829.3 | 31,339.9 | 32,927.0 |
| EBIT, % | 4.09 | 3.61 | 3.13 | 3.78 | 4.26 | 3.78 | 3.78 | 3.78 | 3.78 | 3.78 |
| Total Cash | 17,741.0 | 14,760.0 | 8,625.0 | 9,867.0 | 9,037.0 | 14,324.1 | 15,049.5 | 15,811.6 | 16,612.4 | 17,453.7 |
| Total Cash, percent | .0 | .0 | .0 | .0 | .0 | .0 | .0 | .0 | .0 | .0 |
| Account Receivables | 6,516.0 | 8,280.0 | 7,933.0 | 8,796.0 | 9,975.0 | 9,631.2 | 10,118.9 | 10,631.4 | 11,169.8 | 11,735.4 |
| Account Receivables, % | 1.17 | 1.45 | 1.3 | 1.36 | 1.46 | 1.35 | 1.35 | 1.35 | 1.35 | 1.35 |
| Inventories | 44,949.0 | 56,511.0 | 56,576.0 | 54,892.0 | 56,435.0 | 62,842.9 | 66,025.4 | 69,369.1 | 72,882.1 | 76,572.9 |
| Inventories, % | 8.04 | 9.87 | 9.26 | 8.47 | 8.29 | 8.78 | 8.78 | 8.78 | 8.78 | 8.78 |
| Accounts Payable | 49,141.0 | 55,261.0 | 53,742.0 | 56,812.0 | 58,666.0 | 63,832.7 | 67,065.3 | 70,461.6 | 74,030.0 | 77,779.0 |
| Accounts Payable, % | 8.79 | 9.65 | 8.79 | 8.77 | 8.61 | 8.92 | 8.92 | 8.92 | 8.92 | 8.92 |
| Capital Expenditure | -10,264.0 | -13,106.0 | -16,857.0 | -20,606.0 | -23,783.0 | -19,393.9 | -20,376.1 | -21,408.0 | -22,492.1 | -23,631.2 |
| Capital Expenditure, % | -1.84 | -2.29 | -2.76 | -3.18 | -3.49 | -2.71 | -2.71 | -2.71 | -2.71 | -2.71 |
| Tax Rate, % | 26.12 | 26.12 | 26.12 | 26.12 | 26.12 | 26.12 | 26.12 | 26.12 | 26.12 | 26.12 |
| EBITAT | 15,030.9 | 15,131.3 | 13,140.7 | 17,415.8 | 21,451.3 | 19,042.7 | 20,007.1 | 21,020.3 | 22,084.8 | 23,203.2 |
| Depreciation | ||||||||||
| Changes in Account Receivables | ||||||||||
| Changes in Inventories | ||||||||||
| Changes in Accounts Payable | ||||||||||
| Capital Expenditure | ||||||||||
| UFCF | 13,594.9 | 5,477.3 | 5,991.7 | 12,553.8 | 9,773.3 | 12,173.0 | 13,294.7 | 13,968.0 | 14,675.4 | 15,418.6 |
| WACC, % | 6.61 | 6.63 | 6.62 | 6.63 | 6.64 | 6.63 | 6.63 | 6.63 | 6.63 | 6.63 |
| PV UFCF | ||||||||||
| SUM PV UFCF | 57,175.3 | |||||||||
| Long Term Growth Rate, % | 1.00 | |||||||||
| Free cash flow (T + 1) | 15,573 | |||||||||
| Terminal Value | 276,842 | |||||||||
| Present Terminal Value | 200,879 | |||||||||
| Enterprise Value | 258,054 | |||||||||
| Net Debt | 51,077 | |||||||||
| Equity Value | 206,977 | |||||||||
| Diluted Shares Outstanding, MM | 8,081 | |||||||||
| Equity Value Per Share | 25.61 |
What You Will Get
- Real WMT Financials: Access to historical and projected data for precise valuation.
- Customizable Inputs: Adjust WACC, tax rates, revenue growth, and capital expenditures as needed.
- Dynamic Calculations: Intrinsic value and NPV are computed in real-time.
- Scenario Analysis: Explore various scenarios to assess Walmart’s future performance.
- User-Friendly Design: Designed for professionals while remaining approachable for newcomers.
Key Features
- Comprehensive Walmart Financials: Access precise pre-loaded historical data and future forecasts.
- Adjustable Forecast Inputs: Modify highlighted fields such as WACC, growth rates, and profit margins.
- Real-Time Calculations: Automatic updates for DCF, Net Present Value (NPV), and cash flow evaluations.
- Interactive Dashboard: User-friendly charts and summaries to help visualize your valuation findings.
- Designed for All Skill Levels: A straightforward, intuitive layout tailored for investors, CFOs, and consultants.
How It Works
- Step 1: Download the Excel file.
- Step 2: Review Walmart's pre-filled financial data and forecasts.
- Step 3: Modify key inputs such as sales growth, WACC, and tax rates (highlighted cells).
- Step 4: Observe the DCF model update in real-time as you adjust your assumptions.
- Step 5: Analyze the results and utilize them for investment decisions.
Why Choose This Calculator for Walmart Inc. (WMT)?
- User-Friendly Interface: Perfect for both novices and seasoned analysts.
- Customizable Inputs: Adjust parameters easily to suit your financial assessment.
- Real-Time Valuation: Watch Walmart’s valuation update instantly as you change inputs.
- Preloaded Data: Comes with Walmart’s actual financial figures for immediate evaluation.
- Relied Upon by Experts: Trusted by investors and financial analysts for sound decision-making.
Who Should Use This Product?
- Finance Students: Explore retail valuation techniques and apply them using real data from Walmart Inc. (WMT).
- Academics: Integrate professional retail models into your coursework or research projects.
- Investors: Validate your investment hypotheses and evaluate valuation outcomes for Walmart Inc. (WMT) stock.
- Analysts: Enhance your analysis process with a pre-built, customizable DCF model tailored for Walmart Inc. (WMT).
- Small Business Owners: Understand the methodologies used to analyze large retailers like Walmart Inc. (WMT).
What the Template Contains
- Comprehensive DCF Model: Editable template featuring detailed valuation calculations.
- Real-World Data: Walmart Inc.’s (WMT) historical and projected financials preloaded for analysis.
- Customizable Parameters: Adjust WACC, growth rates, and tax assumptions to explore different scenarios.
- Financial Statements: Complete annual and quarterly breakdowns for enhanced insights.
- Key Ratios: Integrated analysis for profitability, efficiency, and leverage metrics.
- Dashboard with Visual Outputs: Charts and tables presenting clear, actionable results.
Disclaimer
All information, articles, and product details provided on this website are for general informational and educational purposes only. We do not claim any ownership over, nor do we intend to infringe upon, any trademarks, copyrights, logos, brand names, or other intellectual property mentioned or depicted on this site. Such intellectual property remains the property of its respective owners, and any references here are made solely for identification or informational purposes, without implying any affiliation, endorsement, or partnership.
We make no representations or warranties, express or implied, regarding the accuracy, completeness, or suitability of any content or products presented. Nothing on this website should be construed as legal, tax, investment, financial, medical, or other professional advice. In addition, no part of this site—including articles or product references—constitutes a solicitation, recommendation, endorsement, advertisement, or offer to buy or sell any securities, franchises, or other financial instruments, particularly in jurisdictions where such activity would be unlawful.
All content is of a general nature and may not address the specific circumstances of any individual or entity. It is not a substitute for professional advice or services. Any actions you take based on the information provided here are strictly at your own risk. You accept full responsibility for any decisions or outcomes arising from your use of this website and agree to release us from any liability in connection with your use of, or reliance upon, the content or products found herein.