
|
Waterstone Financial, Inc. (WSBF) Évaluation DCF |
Entièrement Modifiable: Adapté À Vos Besoins Dans Excel Ou Sheets
Conception Professionnelle: Modèles Fiables Et Conformes Aux Normes Du Secteur
Pré-Construits Pour Une Utilisation Rapide Et Efficace
Compatible MAC/PC, entièrement débloqué
Aucune Expertise N'Est Requise; Facile À Suivre
Waterstone Financial, Inc. (WSBF) Bundle
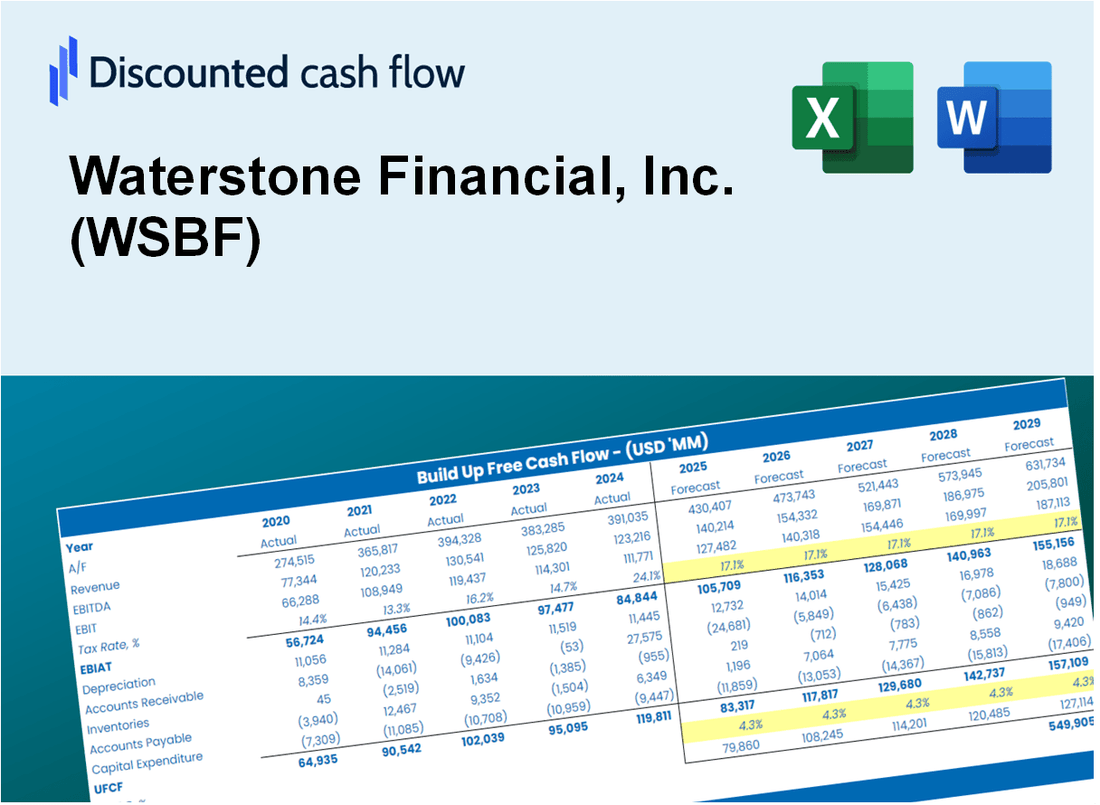
Améliorez vos stratégies d'investissement avec la calculatrice DCF Waterstone Financial, Inc. (WSBF)! Utiliser les données financières réelles, ajuster les projections et les dépenses de croissance et visualiser instantanément comment ces modifications affectent la valeur intrinsèque de Waterstone Financial, Inc. (WSBF).
What You Will Get
- Real WSBF Financials: Access to historical and forecasted data for precise valuation.
- Customizable Inputs: Adjust WACC, tax rates, revenue growth, and capital expenditures as needed.
- Dynamic Calculations: Intrinsic value and NPV are updated automatically.
- Scenario Analysis: Evaluate various scenarios to assess Waterstone Financial's future performance.
- User-Friendly Design: Designed for professionals while remaining approachable for newcomers.
Key Features
- Comprehensive Historical Data: Waterstone Financial’s (WSBF) past financial statements and detailed projections.
- Customizable Inputs: Modify WACC, tax rates, revenue growth, and EBITDA margins as needed.
- Real-Time Calculations: Instantly view the intrinsic value of Waterstone Financial (WSBF) as it updates live.
- Intuitive Visualizations: Dashboard graphs illustrate valuation outcomes and essential metrics.
- Designed for Precision: A reliable resource for analysts, investors, and finance professionals.
How It Works
- Step 1: Download the prebuilt Excel template featuring Waterstone Financial, Inc.’s (WSBF) data.
- Step 2: Navigate through the pre-filled sheets to grasp the essential metrics.
- Step 3: Modify forecasts and assumptions in the editable yellow cells (WACC, growth, margins).
- Step 4: Instantly view the recalculated results, including the intrinsic value of Waterstone Financial, Inc. (WSBF).
- Step 5: Make informed investment decisions or create reports based on the outputs.
Why Choose This Calculator for Waterstone Financial, Inc. (WSBF)?
- Accurate Data: Up-to-date Waterstone Financial financials provide dependable valuation outcomes.
- Customizable: Tailor essential parameters such as growth rates, WACC, and tax rates to align with your forecasts.
- Time-Saving: Pre-configured calculations save you the hassle of starting from the ground up.
- Professional-Grade Tool: Crafted for investors, analysts, and consultants in the financial sector.
- User-Friendly: Easy-to-navigate design and clear instructions make it accessible for all users.
Who Should Use This Product?
- Investors: Accurately assess Waterstone Financial, Inc.’s (WSBF) fair value prior to making investment choices.
- CFOs: Utilize a high-quality DCF model for financial analysis and reporting.
- Consultants: Easily modify the template for client valuation reports.
- Entrepreneurs: Acquire knowledge of financial modeling techniques employed by leading financial institutions.
- Educators: Employ it as a resource for teaching valuation methods and practices.
What the Template Contains
- Pre-Filled DCF Model: Waterstone Financial, Inc.'s (WSBF) financial data preloaded for immediate use.
- WACC Calculator: Detailed calculations for Weighted Average Cost of Capital.
- Financial Ratios: Evaluate Waterstone Financial, Inc.'s (WSBF) profitability, leverage, and efficiency.
- Editable Inputs: Change assumptions such as growth, margins, and CAPEX to fit your scenarios.
- Financial Statements: Annual and quarterly reports to support detailed analysis.
- Interactive Dashboard: Easily visualize key valuation metrics and results.
Disclaimer
All information, articles, and product details provided on this website are for general informational and educational purposes only. We do not claim any ownership over, nor do we intend to infringe upon, any trademarks, copyrights, logos, brand names, or other intellectual property mentioned or depicted on this site. Such intellectual property remains the property of its respective owners, and any references here are made solely for identification or informational purposes, without implying any affiliation, endorsement, or partnership.
We make no representations or warranties, express or implied, regarding the accuracy, completeness, or suitability of any content or products presented. Nothing on this website should be construed as legal, tax, investment, financial, medical, or other professional advice. In addition, no part of this site—including articles or product references—constitutes a solicitation, recommendation, endorsement, advertisement, or offer to buy or sell any securities, franchises, or other financial instruments, particularly in jurisdictions where such activity would be unlawful.
All content is of a general nature and may not address the specific circumstances of any individual or entity. It is not a substitute for professional advice or services. Any actions you take based on the information provided here are strictly at your own risk. You accept full responsibility for any decisions or outcomes arising from your use of this website and agree to release us from any liability in connection with your use of, or reliance upon, the content or products found herein.