
|
Zeekr Intelligent Technology Holding Limited (ZK) Valation DCF |
Entièrement Modifiable: Adapté À Vos Besoins Dans Excel Ou Sheets
Conception Professionnelle: Modèles Fiables Et Conformes Aux Normes Du Secteur
Pré-Construits Pour Une Utilisation Rapide Et Efficace
Compatible MAC/PC, entièrement débloqué
Aucune Expertise N'Est Requise; Facile À Suivre
ZEEKR Intelligent Technology Holding Limited (ZK) Bundle
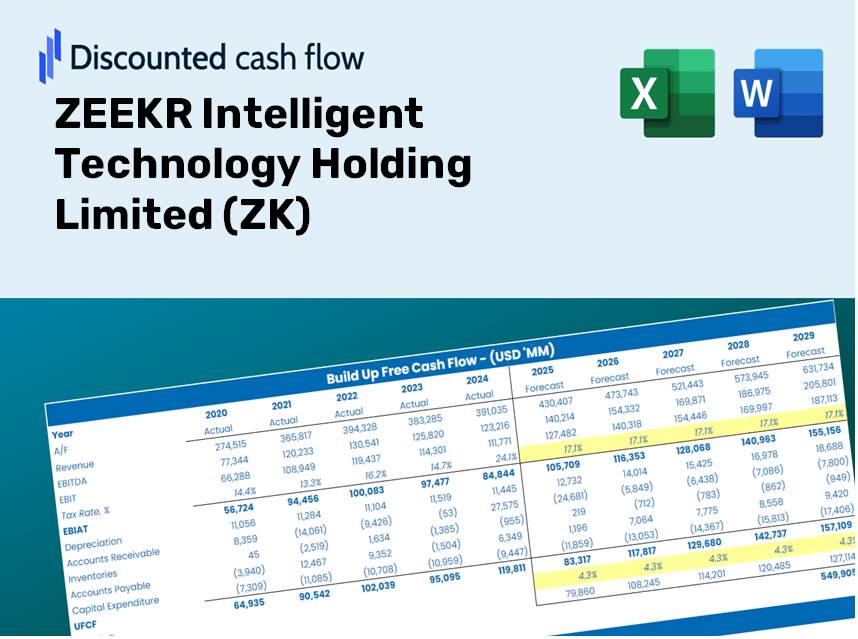
Vous cherchez à évaluer la valeur intrinsèque de Zeekr Intelligent Technology Holding Limited? Notre calculatrice ZK DCF intègre des données réelles avec des options de personnalisation complètes, vous permettant d'ajuster les prévisions et de faire des choix d'investissement plus éclairés.
Discounted Cash Flow (DCF) - (USD MM)
| Year | AY1 2020 |
AY2 2021 |
AY3 2022 |
AY4 2023 |
AY5 2024 |
FY1 2025 |
FY2 2026 |
FY3 2027 |
FY4 2028 |
FY5 2029 |
|---|---|---|---|---|---|---|---|---|---|---|
| Revenue | 447.7 | 917.6 | 4,484.3 | 7,263.9 | 10,671.5 | 18,912.4 | 33,517.4 | 59,400.9 | 105,272.8 | 186,568.8 |
| Revenue Growth, % | 0 | 104.94 | 388.69 | 61.99 | 46.91 | 77.22 | 77.22 | 77.22 | 77.22 | 77.22 |
| EBITDA | 19.1 | -592.2 | -971.8 | -1,030.1 | -646.5 | -3,864.7 | -6,849.1 | -12,138.3 | -21,512.1 | -38,124.6 |
| EBITDA, % | 4.28 | -64.54 | -21.67 | -14.18 | -6.06 | -20.43 | -20.43 | -20.43 | -20.43 | -20.43 |
| Depreciation | 7.5 | 12.6 | 33.6 | 86.9 | 132.8 | 235.8 | 417.9 | 740.6 | 1,312.5 | 2,326.1 |
| Depreciation, % | 1.67 | 1.38 | 0.74956 | 1.2 | 1.24 | 1.25 | 1.25 | 1.25 | 1.25 | 1.25 |
| EBIT | 11.7 | -604.8 | -1,005.4 | -1,117.0 | -779.3 | -4,100.5 | -7,267.0 | -12,878.9 | -22,824.6 | -40,450.7 |
| EBIT, % | 2.61 | -65.92 | -22.42 | -15.38 | -7.3 | -21.68 | -21.68 | -21.68 | -21.68 | -21.68 |
| Total Cash | 20.0 | 547.4 | 500.7 | 458.4 | 1,094.1 | 3,473.8 | 6,156.4 | 10,910.6 | 19,336.2 | 34,268.4 |
| Total Cash, percent | .0 | .0 | .0 | .0 | .0 | .0 | .0 | .0 | .0 | .0 |
| Account Receivables | 2.1 | 578.4 | 43.2 | 223.8 | 1,466.2 | 3,074.8 | 5,449.4 | 9,657.6 | 17,115.6 | 30,333.0 |
| Account Receivables, % | 0.47293 | 63.03 | 0.9632 | 3.08 | 13.74 | 16.26 | 16.26 | 16.26 | 16.26 | 16.26 |
| Inventories | 27.3 | 170.7 | 444.9 | 735.0 | 583.5 | 1,898.8 | 3,365.1 | 5,963.8 | 10,569.4 | 18,731.5 |
| Inventories, % | 6.09 | 18.6 | 9.92 | 10.12 | 5.47 | 10.04 | 10.04 | 10.04 | 10.04 | 10.04 |
| Accounts Payable | 77.6 | 779.0 | 1,851.6 | 577.0 | 572.5 | 5,931.8 | 10,512.6 | 18,630.9 | 33,018.4 | 58,516.6 |
| Accounts Payable, % | 17.33 | 84.9 | 41.29 | 7.94 | 5.36 | 31.36 | 31.36 | 31.36 | 31.36 | 31.36 |
| Capital Expenditure | -17.3 | -16.5 | -19.2 | -269.0 | -241.1 | -455.4 | -807.0 | -1,430.3 | -2,534.8 | -4,492.2 |
| Capital Expenditure, % | -3.86 | -1.79 | -0.42807 | -3.7 | -2.26 | -2.41 | -2.41 | -2.41 | -2.41 | -2.41 |
| Tax Rate, % | -14.42 | -14.42 | -14.42 | -14.42 | -14.42 | -14.42 | -14.42 | -14.42 | -14.42 | -14.42 |
| EBITAT | 8.4 | -581.9 | -1,059.6 | -1,136.7 | -891.8 | -3,838.3 | -6,802.5 | -12,055.6 | -21,365.5 | -37,864.8 |
| Depreciation | ||||||||||
| Changes in Account Receivables | ||||||||||
| Changes in Inventories | ||||||||||
| Changes in Accounts Payable | ||||||||||
| Capital Expenditure | ||||||||||
| UFCF | 46.8 | -604.0 | 288.4 | -3,064.1 | -2,095.5 | -1,622.5 | -6,451.7 | -11,434.0 | -20,263.7 | -35,912.2 |
| WACC, % | 4.18 | 4.41 | 4.44 | 4.44 | 4.44 | 4.38 | 4.38 | 4.38 | 4.38 | 4.38 |
| PV UFCF | ||||||||||
| SUM PV UFCF | -63,574.6 | |||||||||
| Long Term Growth Rate, % | 2.00 | |||||||||
| Free cash flow (T + 1) | -36,630 | |||||||||
| Terminal Value | -1,536,457 | |||||||||
| Present Terminal Value | -1,239,793 | |||||||||
| Enterprise Value | -1,303,367 | |||||||||
| Net Debt | 1,099 | |||||||||
| Equity Value | -1,304,466 | |||||||||
| Diluted Shares Outstanding, MM | 235 | |||||||||
| Equity Value Per Share | -5,543.79 |
What You Will Receive
- Customizable Excel Template: A fully adaptable Excel-based DCF Calculator featuring pre-filled real ZK financial data.
- Authentic Data: Access to historical figures and future projections (highlighted in the yellow cells).
- Forecast Adaptability: Modify key assumptions such as revenue growth, EBITDA %, and WACC at your discretion.
- Instant Calculations: Quickly visualize how your inputs influence ZK's valuation.
- Professional Resource: Designed for investors, CFOs, consultants, and financial analysts alike.
- Intuitive Design: Organized for simplicity and ease of use, complete with step-by-step guidance.
Key Features
- Comprehensive DCF Calculator: Features detailed unlevered and levered DCF valuation models tailored for ZEEKR Intelligent Technology Holding Limited (ZK).
- WACC Calculator: Ready-to-use Weighted Average Cost of Capital spreadsheet with adjustable inputs specific to (ZK).
- Customizable Forecast Assumptions: Update growth rates, capital expenditures, and discount rates as needed.
- Integrated Financial Ratios: Evaluate profitability, leverage, and efficiency ratios for ZEEKR Intelligent Technology Holding Limited (ZK).
- Interactive Dashboard and Charts: Visual representations provide a quick overview of key valuation metrics for straightforward analysis.
How It Functions
- 1. Access the Template: Download and open the Excel spreadsheet containing ZEEKR's preloaded data.
- 2. Modify Assumptions: Adjust essential inputs such as growth rates, WACC, and capital expenditures.
- 3. Get Instant Results: The DCF model automatically calculates the intrinsic value and NPV.
- 4. Explore Scenarios: Evaluate multiple forecasts to assess various valuation outcomes.
- 5. Present with Assurance: Deliver professional valuation insights to back your decisions.
Why Choose This Calculator for ZEEKR Intelligent Technology Holding Limited (ZK)?
- User-Friendly Interface: Perfect for both novice users and seasoned professionals.
- Customizable Inputs: Effortlessly adjust parameters to suit your specific analysis.
- Immediate Feedback: Witness real-time fluctuations in ZEEKR's valuation as you change inputs.
- Preloaded Data: Comes with ZEEKR’s actual financial information for swift evaluations.
- Endorsed by Industry Experts: Preferred by investors and analysts for making well-informed choices.
Who Can Benefit from ZEEKR's Offering?
- Investors: Gain confidence in your investment choices with ZEEKR's advanced valuation tools.
- Financial Analysts: Streamline your process with a customizable DCF model designed for efficiency.
- Consultants: Easily modify templates for impactful client presentations and reports.
- Finance Enthusiasts: Enhance your knowledge of valuation methods through real-world applications.
- Educators and Students: Utilize this product as an effective resource for finance education.
Contents of the Template
- Pre-Filled Data: Contains ZEEKR Intelligent Technology Holding Limited's historical financials and projections.
- Discounted Cash Flow Model: An editable DCF valuation model featuring automatic calculations.
- Weighted Average Cost of Capital (WACC): A dedicated sheet for WACC calculations based on user-defined inputs.
- Key Financial Ratios: Evaluate ZEEKR's profitability, efficiency, and financial leverage.
- Customizable Inputs: Easily modify revenue growth rates, margins, and tax assumptions.
- Clear Dashboard: Visual charts and tables summarizing essential valuation outcomes.
Disclaimer
All information, articles, and product details provided on this website are for general informational and educational purposes only. We do not claim any ownership over, nor do we intend to infringe upon, any trademarks, copyrights, logos, brand names, or other intellectual property mentioned or depicted on this site. Such intellectual property remains the property of its respective owners, and any references here are made solely for identification or informational purposes, without implying any affiliation, endorsement, or partnership.
We make no representations or warranties, express or implied, regarding the accuracy, completeness, or suitability of any content or products presented. Nothing on this website should be construed as legal, tax, investment, financial, medical, or other professional advice. In addition, no part of this site—including articles or product references—constitutes a solicitation, recommendation, endorsement, advertisement, or offer to buy or sell any securities, franchises, or other financial instruments, particularly in jurisdictions where such activity would be unlawful.
All content is of a general nature and may not address the specific circumstances of any individual or entity. It is not a substitute for professional advice or services. Any actions you take based on the information provided here are strictly at your own risk. You accept full responsibility for any decisions or outcomes arising from your use of this website and agree to release us from any liability in connection with your use of, or reliance upon, the content or products found herein.