
|
Shenzhen Cereals Holdings Co., Ltd. (000019.SZ) DCF Valuation |
Fully Editable: Tailor To Your Needs In Excel Or Sheets
Professional Design: Trusted, Industry-Standard Templates
Investor-Approved Valuation Models
MAC/PC Compatible, Fully Unlocked
No Expertise Is Needed; Easy To Follow
Shenzhen Cereals Holdings Co., Ltd. (000019.SZ) Bundle
Evaluate the financial outlook of Shenzhen Cereals Holdings Co., Ltd. like an expert! This (000019SZ) DCF Calculator is equipped with pre-filled financials and offers full flexibility to modify revenue growth, WACC, margins, and other crucial assumptions to align with your projections.
What You Will Receive
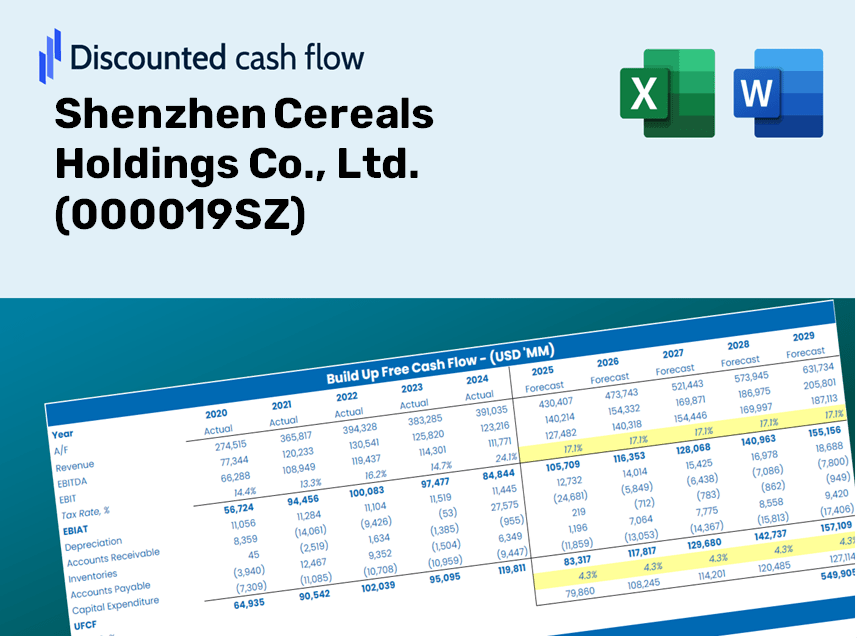
- Authentic Shenzhen Cereals Data: Comprehensive financials – covering revenue to EBIT – derived from actual and forecasted figures.
- Complete Customization: Modify all essential parameters (yellow cells) such as WACC, growth %, and tax rates.
- Immediate Valuation Adjustments: Automated recalculations to assess the effects of changes on Shenzhen Cereals’ fair value.
- Flexible Excel Template: Designed for quick modifications, scenario simulations, and in-depth forecasts.
- Efficient and Accurate: Eliminate the need to build models from the ground up while ensuring accuracy and adaptability.
Key Features
- Pre-Loaded Data: Shenzhen Cereals Holdings Co., Ltd.'s historical financial statements and pre-filled forecasts.
- Fully Adjustable Inputs: Customize WACC, tax rates, revenue growth, and EBITDA margins.
- Instant Results: View Shenzhen Cereals Holdings Co., Ltd.'s intrinsic value recalculating in real time.
- Clear Visual Outputs: Dashboard charts illustrate valuation results and key metrics.
- Built for Accuracy: A professional tool designed for analysts, investors, and finance experts.
How It Works
- Step 1: Download the prebuilt Excel template containing Shenzhen Cereals Holdings Co., Ltd.'s (000019SZ) data.
- Step 2: Review the pre-filled sheets to familiarize yourself with the key performance indicators.
- Step 3: Adjust forecasts and assumptions in the editable yellow cells (WACC, growth rates, profit margins).
- Step 4: Instantly see recalibrated outputs, including the intrinsic value of Shenzhen Cereals Holdings Co., Ltd. (000019SZ).
- Step 5: Use the results to make informed investment choices or compile reports based on the findings.
Why Opt for This Calculator?
- Accuracy: Based on authentic financial data from Shenzhen Cereals Holdings Co., Ltd. (000019SZ), ensuring precise information.
- Flexibility: Users can easily test and adjust inputs to suit their needs.
- Time-Saving: Eliminate the need to create a DCF model from the ground up.
- Professional-Grade: Crafted with the expertise and usability considerations of CFO-level professionals.
- User-Friendly: Intuitive for users, even those without extensive financial modeling knowledge.
Who Should Utilize This Product?
- Individual Investors: Make informed decisions regarding the purchase or sale of Shenzhen Cereals Holdings Co., Ltd. (000019SZ) stock.
- Financial Analysts: Enhance valuation processes with readily available financial models tailored for Shenzhen Cereals Holdings Co., Ltd. (000019SZ).
- Consultants: Provide clients with accurate and timely valuation insights related to Shenzhen Cereals Holdings Co., Ltd. (000019SZ).
- Business Owners: Gain a clear understanding of valuation methods used for companies like Shenzhen Cereals Holdings Co., Ltd. (000019SZ) to inform your strategic decisions.
- Finance Students: Acquire knowledge of valuation techniques through real-world data and case studies focused on Shenzhen Cereals Holdings Co., Ltd. (000019SZ).
Contents of the Template
- Comprehensive DCF Model: An editable template featuring detailed valuation calculations.
- Real-World Data: Historical and projected financials for Shenzhen Cereals Holdings Co., Ltd. (000019SZ) preloaded for in-depth analysis.
- Customizable Parameters: Modify WACC, growth rates, and tax assumptions to explore various scenarios.
- Financial Statements: Complete annual and quarterly breakdowns for enhanced insights.
- Key Ratios: Integrated analysis covering profitability, efficiency, and leverage metrics.
- Dashboard with Visual Outputs: Engaging charts and tables providing clear, actionable results.
Disclaimer
All information, articles, and product details provided on this website are for general informational and educational purposes only. We do not claim any ownership over, nor do we intend to infringe upon, any trademarks, copyrights, logos, brand names, or other intellectual property mentioned or depicted on this site. Such intellectual property remains the property of its respective owners, and any references here are made solely for identification or informational purposes, without implying any affiliation, endorsement, or partnership.
We make no representations or warranties, express or implied, regarding the accuracy, completeness, or suitability of any content or products presented. Nothing on this website should be construed as legal, tax, investment, financial, medical, or other professional advice. In addition, no part of this site—including articles or product references—constitutes a solicitation, recommendation, endorsement, advertisement, or offer to buy or sell any securities, franchises, or other financial instruments, particularly in jurisdictions where such activity would be unlawful.
All content is of a general nature and may not address the specific circumstances of any individual or entity. It is not a substitute for professional advice or services. Any actions you take based on the information provided here are strictly at your own risk. You accept full responsibility for any decisions or outcomes arising from your use of this website and agree to release us from any liability in connection with your use of, or reliance upon, the content or products found herein.