
|
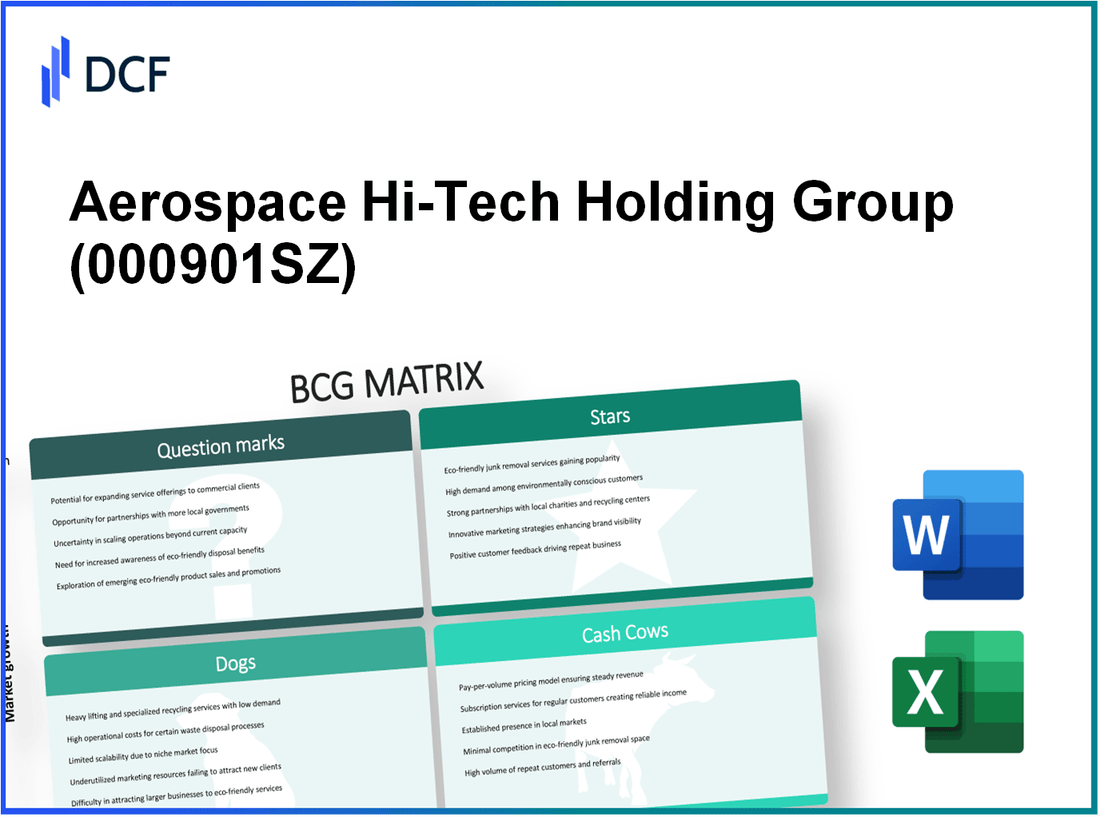
Aerospace Hi-Tech Holding Group Co., Ltd. (000901.SZ): BCG Matrix [Apr-2026 Updated] |
Fully Editable: Tailor To Your Needs In Excel Or Sheets
Professional Design: Trusted, Industry-Standard Templates
Investor-Approved Valuation Models
MAC/PC Compatible, Fully Unlocked
No Expertise Is Needed; Easy To Follow
Aerospace Hi-Tech Holding Group Co., Ltd. (000901.SZ) Bundle
Aerospace Hi‑Tech's mix reads like a focused pivot: high‑growth Stars-advanced ADAS and high‑precision aerospace electronics-are driving margins and attracting heavy CAPEX (notably 450M RMB for imaging radar and robust R&D spend), while mature Cash Cows-traditional occupant detection and standardized aerospace instruments-generate the steady cash (over 800M RMB free cash flow) that fuels those bets; two ambitious Question Marks in industrial IoT and EV thermal management are capitalized for scale (200M RMB into thermal) but still low share, and underperforming Dogs in petroleum and low‑end sensors are being starved of investment, signaling a clear strategy to double down on smart mobility and aerospace while pruning legacy lines-read on to see which bets are likely to pay off.
Aerospace Hi-Tech Holding Group Co., Ltd. (000901.SZ) - BCG Matrix Analysis: Stars
Stars
Advanced ADAS and Intelligent Sensing Systems represent a Star business within Aerospace Hi-Tech's portfolio, driven by rapid NEV adoption and high market growth. The automotive electronics segment accounted for 68% of total group revenue as of late 2025. ADAS component markets are growing at an estimated 22% CAGR. Through IEE, the group holds a 15% global market share in specialized occupant detection sensors. Management committed 450 million RMB in CAPEX during the current year to expand high‑definition imaging radar production lines. Gross margin for this ADAS/sensing cluster is approximately 28%, materially above the company's legacy hardware lines. These assets combine high growth, above‑average margins, and strategic scale to sustain competitive positioning in smart mobility.
| Metric | ADAS & Intelligent Sensing |
|---|---|
| Share of Group Revenue (late 2025) | 68% |
| Market Growth Rate (ADAS) | 22% CAGR |
| Global Market Share (occupant detection sensors) | 15% (IEE) |
| 2025 CAPEX | 450 million RMB (imaging radar production) |
| Gross Margin | 28% |
| Strategic advantages | Scale in sensors, IP in occupant detection, production expansion for HD radar |
- Revenue concentration: 68% of group revenue; accelerates cash generation and reinvestment capacity.
- High growth: 22% market expansion provides runway for volume and ASP improvements.
- Investment intensity: 450M RMB CAPEX to secure capacity and time‑to‑market advantage for imaging radar.
- Profitability: 28% gross margin supports funding of R&D and commercialization of adjacent modules (fusion sensors, perception software).
- Market positioning: 15% global share in a specialized sensor niche strengthens pricing power and OEM relationships.
High Precision Aerospace Electronic Components are a second Star, combining strong domestic demand, commanding market share in mission‑critical sensors, and high operating margins. The aerospace products division contributes ~18% of total revenue and delivers a return on invested capital of approximately 14%. China's domestic aerospace market is expanding at over 15% annually driven by satellite constellation build‑out and launch cadence increases. The group holds a 40% domestic market share for specific high‑reliability pressure sensors used in launch vehicles. R&D spending on next‑generation telemetry systems reached 120 million RMB in fiscal 2025. Operating margins for these aerospace components are near 32%, reflecting premium pricing, high reliability requirements, and long‑term contracted revenue streams underpinned by government support.
| Metric | High Precision Aerospace Components |
|---|---|
| Share of Group Revenue | ~18% |
| Domestic Market Growth | >15% (aerospace market) |
| Domestic Market Share (pressure sensors) | 40% |
| 2025 R&D Spend | 120 million RMB (telemetry systems) |
| ROI | ~14% |
| Operating Margin | ~32% |
| Strategic advantages | High reliability, government contracts, premium pricing, long‑term procurement |
- Revenue mix: Aerospace division provides diversification away from automotive cyclicality while commanding high margins.
- Market dominance: 40% domestic share in critical pressure sensors creates barrier to entry and supply stability for launch programs.
- R&D commitment: 120M RMB supports next‑gen telemetry that can expand lifetime contracts and module-level integration opportunities.
- Contract stability: Government and prime contractor relationships reduce revenue volatility and support capital allocation planning.
Aerospace Hi-Tech Holding Group Co., Ltd. (000901.SZ) - BCG Matrix Analysis: Cash Cows
Cash Cows
Traditional Automotive Occupant Detection Systems
The Traditional Automotive Occupant Detection Systems division is a mature, stable cash-generating unit. It accounts for 35% of the total automotive segment revenue and continues to secure sustained free cash flow despite low market expansion. Key performance and financial metrics for this business unit through FY2025 are summarized below.
| Metric | Value | Comment |
|---|---|---|
| Share of automotive segment revenue | 35% | Primary contributor within automotive product lines |
| Market growth rate (annual) | 4% | Low-growth, mature market |
| Global relative market share | 25% | Market leader position |
| CapEx requirement | 5% of annual revenue | Minimal reinvestment needs |
| Net profit margin | 12% | Stabilized through 2025 |
| Free cash flow generated (FY2025) | RMB 800 million+ | Supports group-level R&D and high-growth ventures |
| R&D intensity (as % of division revenue) | 2% | Focused on incremental improvements and reliability |
| Customer concentration (top 5 OEMs) | 60% of division revenue | High dependence on major automotive OEM contracts |
| Annual production volume (units) | ~4.5 million units | High-volume manufacturing scale |
| Unit contribution margin | ~RMB 180 per unit | Stable due to scale and low input volatility |
- Cash generation: Produces net operating cash flow sufficient to fund >70% of group R&D commitments for new sensors.
- Investment profile: Low incremental capital required; focus on process efficiency and yield improvement.
- Risk profile: Exposure to automotive cyclicality and OEM procurement timing; mitigated by long-term supply agreements.
- Strategic role: Financial backbone enabling allocation of capital to Stars and Question Marks within the group portfolio.
Standardized Aerospace Measurement Instruments
The Standardized Aerospace Measurement Instruments division delivers reliable, low-risk revenue, contributing 10% of total corporate revenue. It operates in a slow-growth legacy market, dominated domestically by Aerospace Hi-Tech with high relative share and attractive margins driven by defense procurement stability.
| Metric | Value | Comment |
|---|---|---|
| Share of corporate revenue | 10% | Consistent contributor to consolidated results |
| Market growth rate (annual) | 3% | Slow but steady legacy component demand |
| Domestic relative market share (defense) | 35% | High share in domestic procurement channels |
| Return on assets (ROA, 2025) | 11% | Efficient asset utilization for mature products |
| Operating margin | 20% | Maintained through pricing power and low reinvestment |
| CapEx intensity | 3% of division revenue | Limited modernization required |
| Order backlog (defense & civil combined) | RMB 450 million | Predictable near-term revenue visibility |
| Gross margin | 28% | Benefit of standardized designs and established supply chain |
| Customer segmentation | Defense 65% / Civil 35% | Defense bias reduces commercial cyclicality |
- Cash stability: Generates recurring operating cash flow sufficient to cover divisional overhead and contribute to corporate dividends.
- Competitive dynamics: Low competitive intensity and high procurement barriers favor incumbency.
- Operational focus: Emphasis on cost control, quality assurance, and contract compliance rather than aggressive market expansion.
- Vulnerability: Limited upside growth; dependence on defense budget cycles and regulatory procurement timelines.
Aerospace Hi-Tech Holding Group Co., Ltd. (000901.SZ) - BCG Matrix Analysis: Question Marks
Dogs (as categorized for this chapter under the 'Question Marks' outline) refer to business units with low relative market share in markets that may exhibit varying growth - here treated as nascent/high-growth opportunities where Aerospace Hi-Tech currently holds limited position. Two specific business units are assessed: Industrial Internet of Things (IIoT) Solutions and New Energy Vehicle (NEV) Thermal Management.
Industrial Internet of Things Solutions: the IIoT segment contributes 6% of group revenue (FY2025 reported revenue 6% of 8.3 billion RMB = ~498 million RMB). China's industrial IoT market CAGR is ~25% (2024-2028). Aerospace Hi-Tech's estimated market share is <3% within the domestic IIoT systems market (~estimated addressable market 120 billion RMB in 2025). The company increased CAPEX and R&D directed to cloud-based monitoring platforms by 60% year-over-year in 2025, raising segment investment from ~45 million RMB (2024) to ~72 million RMB (2025). Current gross margin in IIoT is ~5%, reflecting a scale-and-customer-acquisition strategy; operating margin is negative after allocated R&D and platform OPEX. Key dependencies: integration of aerospace-grade sensors with SaaS ecosystems, partner channel development, and migration of pilot customers to subscription contracts.
| Metric | Value (IIoT) |
|---|---|
| FY2025 Revenue (estimated) | ~498 million RMB |
| Group revenue share | 6% |
| Domestic market CAGR | 25% (2024-2028) |
| Company market share | <3% |
| 2025 IIoT investment (YoY increase) | +60% (~72 million RMB total) |
| Gross margin | ~5% |
| Primary revenue model | Hardware sales + emerging SaaS/subscription |
| Breakeven horizon (management target) | 3-5 years conditional on scale |
New Energy Vehicle Thermal Management: this unit targets a rapidly expanding niche with an estimated market growth of ~30% per year. Aerospace Hi-Tech has captured a preliminary 2% share among Tier-1 domestic EV manufacturers, with 2025 segment revenue approximated at 166 million RMB (2% of an estimated 8.3 billion RMB NEV thermal systems domestic TAM relevant to the company). The company invested 200 million RMB in 2025 to develop integrated thermal control modules optimized for long-range battery packs. Current reported ROI for the unit is -4% (negative due to upfront R&D and prototyping costs), and per-unit gross margins are currently improving but remain compressed by warranty provisions and custom engineering. Analysts model scenarios where, if the company achieves supply contracts with 3-4 additional OEMs and achieves production ramp, the unit could reach ~10% of group revenue (~830 million RMB) by 2028.
| Metric | Value (NEV Thermal Mgmt) |
|---|---|
| 2025 Investment | 200 million RMB |
| Current market share (target OEMs) | ~2% |
| Segment CAGR | ~30% (2024-2028) |
| 2025 segment revenue (estimated) | ~166 million RMB |
| Current ROI | -4% |
| Projected contribution by 2028 (analyst scenario) | ~10% of group revenue (~830 million RMB) |
| Key technical barrier | Battery pack thermal integration, qualification cycles, OEM validation |
Common characteristics and strategic levers for these 'Dogs'/Question Marks:
- Low current relative market share (<3% for IIoT; ~2% for NEV thermal) contrasted with high market growth (25-30% CAGR).
- Significant upfront investments (IIoT platform +60% CAPEX; 200 million RMB for NEV thermal R&D) depressing near-term profitability.
- Thin current margins (IIoT gross ~5%; NEV ROI -4%) with path to scale-dependent margin expansion.
- High technical competency (sensor tech, thermal engineering) that can be leveraged into integrated software-hardware solutions to improve customer stickiness and ASPs.
Risks, KPIs and go/no-go triggers to monitor:
- Customer acquisition cost (CAC) vs. lifetime value (LTV) in IIoT: target LTV/CAC >3 within 36 months.
- OEM qualification milestones for NEV thermal: successful long-term validation with 2 additional Tier-1 OEMs by end-2026.
- Platform utilization and subscription conversion rate for IIoT: aim for >25% ARR conversion of hardware-installed base by 2027.
- Unit economics: target gross margin >20% for NEV thermal at >50k annual module volumes.
- Capital allocation threshold: incremental R&D or M&A funding contingent on hitting pilot-to-production conversion rates above 40% within 18 months.
Aerospace Hi-Tech Holding Group Co., Ltd. (000901.SZ) - BCG Matrix Analysis: Dogs
Dogs - Legacy Petroleum Exploration Equipment
The petroleum instrument segment now contributes 4% of group revenue, with annual revenue estimated at RMB 120 million (FY2025 pro forma). Market growth for petroleum exploration equipment is negative at -2% annually as global energy transition reduces upstream investment. Aerospace Hi-Tech's relative market share in this segment is approximately 5% versus leading specialized vendors. Reported operating margin for the division has compressed to 2%, with maintenance and warranty costs representing ~40% of segment gross costs. CAPEX allocated to this division has been reduced to near-zero, reported at RMB 1 million for the current planning cycle, to limit further capital deployment.
Key financial and market metrics for the Legacy Petroleum Exploration Equipment unit:
| Metric | Value |
|---|---|
| Revenue Contribution to Group | 4% (≈ RMB 120 million) |
| Market Growth Rate | -2% CAGR |
| Company Market Share | ~5% |
| Operating Margin | 2% |
| Maintenance/Warranty Cost Share of Gross Costs | ~40% |
| Allocated CAPEX (Current Cycle) | RMB 1 million |
| Strategic Posture | De‑prioritized; maintain minimal support; evaluate phased exit |
Dogs - Basic Environmental Monitoring Hardware
Basic environmental sensors now represent less than 3% of group turnover (≈ RMB 90 million FY2025). The low-end monitoring hardware market is oversupplied and nearly stagnant, with growth at ~1% annually. Aerospace Hi-Tech's share of this commoditized market is negligible at ~1.5%. Return on investment for the product line is approximately 1%, well below the corporate hurdle rate of 8-10%. Management has initiated a strategic review with a target decision to divest or discontinue by end-FY2026 unless clear value can be demonstrated.
Key financial and market metrics for the Basic Environmental Monitoring Hardware unit:
| Metric | Value |
|---|---|
| Revenue Contribution to Group | <3% (≈ RMB 90 million) |
| Market Growth Rate | ~1% CAGR |
| Company Market Share | ~1.5% |
| Return on Investment (ROI) | ~1% |
| Strategic Timeline | Strategic review; potential divestment by FY2026 |
| Alignment with Core Strategy | Low - misaligned with high‑margin aerospace & automotive focus |
Common characteristics and implications for both Dog units:
- Low revenue contribution (combined ≈ 7% of group revenue).
- Minimal or negative market growth (-2% to +1%).
- Very low relative market share (1.5%-5%).
- Operating margins/ROI far below corporate targets (1%-2%).
- CAPEX reduced to preserve cash and avoid further capital erosion.
- Units consume management attention disproportionate to financial return.
Recommended near-term actions under review by management:
- Maintain only essential service and warranty support to preserve customer relationships while minimizing spend.
- Execute formal divestment or shutdown feasibility studies with target decision dates by end-FY2026.
- Identify potential buyers or carve‑out partners for the petroleum instrument assets and low‑end sensor product lines.
- Reallocate any freed resources (human capital, R&D, working capital) to high‑margin aerospace and automotive initiatives showing higher growth and ROIC.
- Implement cost-to-exit analyses including severance, inventory write-downs, and contract termination costs to quantify exit economics.
Disclaimer
All information, articles, and product details provided on this website are for general informational and educational purposes only. We do not claim any ownership over, nor do we intend to infringe upon, any trademarks, copyrights, logos, brand names, or other intellectual property mentioned or depicted on this site. Such intellectual property remains the property of its respective owners, and any references here are made solely for identification or informational purposes, without implying any affiliation, endorsement, or partnership.
We make no representations or warranties, express or implied, regarding the accuracy, completeness, or suitability of any content or products presented. Nothing on this website should be construed as legal, tax, investment, financial, medical, or other professional advice. In addition, no part of this site—including articles or product references—constitutes a solicitation, recommendation, endorsement, advertisement, or offer to buy or sell any securities, franchises, or other financial instruments, particularly in jurisdictions where such activity would be unlawful.
All content is of a general nature and may not address the specific circumstances of any individual or entity. It is not a substitute for professional advice or services. Any actions you take based on the information provided here are strictly at your own risk. You accept full responsibility for any decisions or outcomes arising from your use of this website and agree to release us from any liability in connection with your use of, or reliance upon, the content or products found herein.