
|
Aerospace Hi-Tech Holding Group Co., Ltd. (000901.SZ): SWOT Analysis [Apr-2026 Updated] |
Fully Editable: Tailor To Your Needs In Excel Or Sheets
Professional Design: Trusted, Industry-Standard Templates
Investor-Approved Valuation Models
MAC/PC Compatible, Fully Unlocked
No Expertise Is Needed; Easy To Follow
Aerospace Hi-Tech Holding Group Co., Ltd. (000901.SZ) Bundle
Aerospace Hi‑Tech stands out with market-leading automotive safety sensors, deep CASC backing, robust R&D and a global manufacturing footprint-strengths that position it to capture fast-growing NEV, low‑altitude and smart‑city opportunities-yet persistent low margins, stretched working capital, heavy exposure to automotive cycles and raw‑material and currency volatility leave its profitability vulnerable; strategic moves in semiconductor M&A and localization could unlock upside, but fierce price competition, geopolitical trade risks, rapid tech shifts and tightening regulations make execution and innovation speed critical to sustaining its advantage.
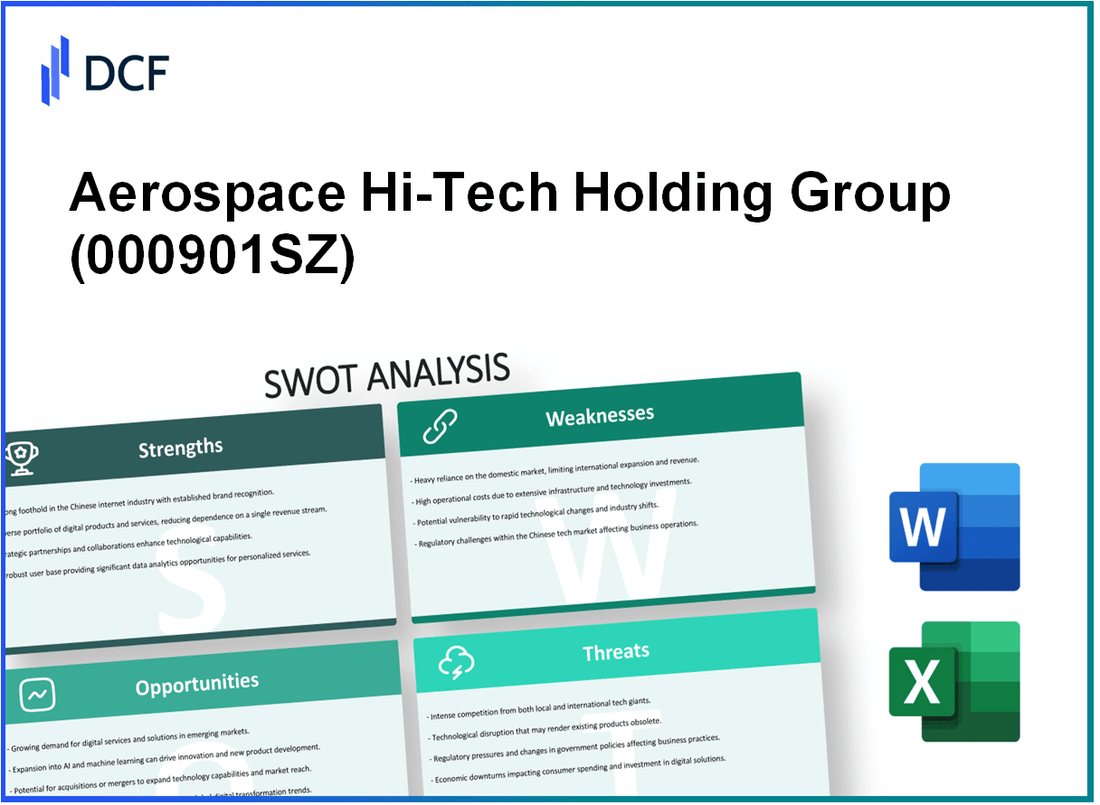
Aerospace Hi-Tech Holding Group Co., Ltd. (000901.SZ) - SWOT Analysis: Strengths
The group holds a dominant market position in automotive safety sensors through its subsidiary IEE, which commands approximately 25% of the global seat occupancy sensor market. In the 2025 fiscal year the automotive electronics segment contributed ~4.8 billion RMB to consolidated revenue, with over 15 million sensor units deployed in the prior 12 months. This segment reports a gross margin of ~18% driven by proprietary SBR and HOD technologies and maintains customer coverage exceeding 90% of top-tier OEMs and Tier-1 suppliers.
| Metric | Value |
|---|---|
| IEE global market share (seat occupancy) | 25% |
| Automotive electronics revenue (2025) | 4.8 billion RMB |
| Units deployed (last 12 months) | 15,000,000 units |
| Automotive segment gross margin | 18% |
| Customer coverage (top-tier OEMs) | >90% |
Strategic alignment with China Aerospace Science and Technology Corporation (CASC) provides privileged access to advanced aerospace R&D, preferential government procurement channels, and stability in capital access via the public listing (000901.SZ). The asset-to-liability ratio stands at ~52%, favorable versus sector peers. Aerospace products achieved 12% YoY revenue growth in 2025, and government contracts account for ~35% of the current order backlog. The company benefits from targeted subsidies under the 14th Five-Year Plan for high-precision sensor localization.
| Metric | Value |
|---|---|
| Asset-to-liability ratio | ~52% |
| Aerospace division revenue growth (2025) | 12% YoY |
| Government contract share (order backlog) | 35% |
| Policy/subsidy support (14th Five-Year Plan) | Significant |
The group's R&D investment and infrastructure are substantial: R&D spending is consistently ~6.5% of total annual revenue. By December 2025 the company held over 850 active patents in MEMS and IoT, and employed ~1,200 specialized R&D engineers across global innovation centers in China and Europe. Product development cycle times for new automotive safety modules have been reduced by ~15% as a result. The company operates three national-level laboratories capable of high-frequency testing for aerospace-grade electronics.
| R&D Metric | Value |
|---|---|
| R&D spend (% of revenue) | 6.5% |
| Active patents (Dec 2025) | 850+ |
| R&D headcount | 1,200 engineers |
| Product development cycle reduction | 15% |
| National-level labs | 3 |
Revenue streams are diversified across automotive, aerospace and environmental IoT, stabilizing margins and reducing single-market exposure. The environmental monitoring segment generated ~650 million RMB in 2025 (≈10% of total revenue). The IoT division serves over 500 corporate clients, delivering recurring service revenue that expanded ~18% in the reported year. Overall net profit margin is maintained at ~2.5% despite cyclical pressures in automotive markets.
| Segment | 2025 Revenue (RMB) | % of Total Revenue | Growth (2025) |
|---|---|---|---|
| Automotive electronics | 4.8 billion | (see note) | - |
| Aerospace products | (included in consolidated) | (included) | 12% YoY |
| Environmental monitoring (IoT) | 650 million | 10% | - |
| IoT services (clients) | Recurring revenue stream | - | 18% growth |
The group maintains an extensive global manufacturing and supply chain footprint with production bases in China, Luxembourg and Mexico, enabling a 95% on-time delivery rate for international automotive clients. The Mexico plant expanded capacity by ~20% in 2025 to serve North American EV demand. The supplier network comprises >2,000 verified vendors, keeping raw material cost variance within ~3%. Geographic revenue mix includes ~45% denominated in non-RMB currencies, providing a natural hedge against FX volatility.
| Supply Chain & Operations Metric | Value |
|---|---|
| Production bases | China, Luxembourg, Mexico |
| On-time delivery rate (international) | 95% |
| Mexico capacity increase (2025) | 20% |
| Verified vendors | >2,000 |
| Raw material cost variance | ~3% |
| Revenue denominated in non-RMB | 45% |
Key strength highlights:
- Market leadership in seat occupancy sensors: 25% global share and 15 million units deployed in 12 months.
- Stable financial posture via CASC alignment: asset-to-liability ≈52% and 35% of backlog from government contracts.
- Consistent R&D commitment: 6.5% of revenue, 850+ patents, 1,200 R&D engineers, three national labs.
- Diversified revenue base: environmental IoT at 650 million RMB (10% of revenue) and IoT services +18% growth.
- Global manufacturing footprint and supply chain scale: >2,000 vendors, 95% on-time delivery, 45% non-RMB revenue.
Aerospace Hi-Tech Holding Group Co., Ltd. (000901.SZ) - SWOT Analysis: Weaknesses
The group records a consolidated net profit margin below 3% on revenue of 7.2 billion RMB in 2025, yielding an approximate net profit of 216 million RMB at the 3% threshold. Cost of sales consumed nearly 82% of gross earnings (≈5.904 billion RMB), producing a gross profit of roughly 1.296 billion RMB and a gross margin near 18%. Rising operating expenses (+7% year-over-year) and elevated administrative costs compress internal capital generation and contribute to a return on equity of 4.2%-a level likely to deter more aggressive institutional investors.
| Metric | 2025 Value | Industry Benchmark / Notes |
|---|---|---|
| Total Revenue | 7.2 billion RMB | - |
| Cost of Sales | ≈5.904 billion RMB (82%) | - |
| Gross Profit | ≈1.296 billion RMB (≈18% gross margin) | - |
| Consolidated Net Profit Margin | <3% (≈216 million RMB at 3%) | Industry average ≈8% |
| Return on Equity (ROE) | 4.2% | - |
| Operating Expense Increase (YoY) | +7% | - |
| G&A Expense Ratio | 9% of revenue | Industry median ≈7% |
The group's liquidity and working capital management are strained by elevated accounts receivable and extended collection cycles. Accounts receivable totaled 2.4 billion RMB at year-end 2025, with average receivable turnover days of 145 days versus an industry benchmark of 110 days. Current ratio stands at 1.15, indicating limited short-term liquidity headroom. Bad debt provisions increased by 5% in the period, reflecting rising credit risk tied to long payment cycles on government and large automotive contracts.
- Accounts receivable: 2.4 billion RMB
- Receivable turnover days: 145 days (benchmark 110 days)
- Current ratio: 1.15
- Bad debt provisions: +5% YoY
Raw material exposure is significant. Specialized electronic components rose ~9% in 2025, and raw material costs now account for approximately 60% of total manufacturing expense. Hedging strategies only cover about 30% of material requirements, leaving a majority of inputs exposed to market volatility. In the IoT division this sensitivity contributed to a 150 basis-point contraction in gross margin during 2025.
| Input / Risk | 2025 Impact | Coverage / Notes |
|---|---|---|
| Specialized electronic components price change | +9% | Directly increased automotive safety production costs |
| Raw material share of manufacturing cost | 60% | High structural sensitivity |
| Hedging coverage | 30% of material requirements | 70% exposed to spot volatility |
| IoT division gross margin contraction | -150 bps | Attributed to material price shocks |
Revenue concentration in the cyclical automotive sector remains a core weakness. The automotive electronics segment accounts for over 65% of group revenue. A 4% slowdown in traditional internal combustion engine (ICE) vehicle production in Europe in 2025 directly reduced orders for the IEE product line. The EV transition requires retooling and capital expenditure; the group spent 300 million RMB in CAPEX in 2025 to adapt production lines, increasing short-term cash outflows and capital intensity.
- Automotive electronics revenue share: >65%
- European ICE production slowdown (2025): -4%
- 2025 CAPEX for EV retooling: 300 million RMB
- Earnings volatility: elevated due to demand cyclicality
Cross-border complexity and integration challenges drive administrative inefficiencies and incremental costs. Managing subsidiaries across Asia and Europe has resulted in operational silos, higher administrative overhead and slower decision-making. The general and administrative expense ratio remains elevated at 9% of revenue (≈648 million RMB) - about 2 percentage points higher than industry median. Compliance with diverse international regulatory frameworks added approximately 45 million RMB to annual operating costs. Communication and cultural integration issues between Beijing headquarters and European units delay market responses and product alignment.
| Organizational Issue | Quantified Impact (2025) | Notes |
|---|---|---|
| G&A expense ratio | 9% of revenue (≈648 million RMB) | ~2% above industry median |
| Regulatory compliance cost | 45 million RMB | International compliance and reporting |
| Operational silos / integration lag | Qualitative: slower responses, missed opportunities | Impact on time-to-market and coordination |
Aerospace Hi-Tech Holding Group Co., Ltd. (000901.SZ) - SWOT Analysis: Opportunities
Expansion into the rapidly growing New Energy Vehicle (NEV) market presents a material revenue opportunity. NEVs require ~40% more sensors per vehicle than ICE vehicles; China's NEV penetration reached 50% in 2025, driving immediate demand for battery management, thermal monitoring, and safety sensors. Aerospace Hi-Tech is bidding for three major sensor contracts with leading EV OEMs, collectively valued at ≈800 million RMB. By adapting HOD (high-order detection) technology for ADAS/autonomy at SAE Levels 3-4, the group can increase value-per-vehicle by ~25%, supporting an expected CAGR of ~15% in the automotive electronics division over the next three years.
The opportunity metrics are summarized below:
| Metric | 2025 Value / Status | Near-Term Impact (3 years) |
|---|---|---|
| NEV penetration (China) | 50% | Higher sensor volume; +40% sensors/vehicle |
| Current major EV bids | 3 contracts; est. 800M RMB | Potential uplift to automotive backlog |
| Value-per-vehicle uplift (HOD for L3-4) | ~25% | Increased ASP and margin per unit |
| Projected automotive electronics CAGR | - | ~15% (next 3 years) |
Emerging demand in the low-altitude economy (eVTOL, commercial drones) creates a distinct adjacent market for aerospace-grade MEMS sensors and flight control units. The eVTOL/commercial drone market in China grew ~30% in 2025. Aerospace Hi-Tech secured a pilot project with a major logistics drone operator contributing 50 million RMB to the 2025 order book. The company's military-grade precision adapted for commercial volumes is a differentiator; management forecasts this sector to contribute ~5% of total revenue by 2027 as certification and infrastructure mature.
- 2025 eVTOL/drone market growth: +30%
- Pilot project revenue contribution (2025): 50M RMB
- Expected revenue share by 2027: ~5% of total
- Key product focus: high-reliability MEMS IMUs, redundant flight controllers
Accelerated domestic substitution of high-end electronic components driven by national industrial policy offers structural tailwinds. Localization of aerospace sensors is increasing at ~20% YoY; Aerospace Hi-Tech, as a CASC-affiliated entity, is positioned to replace foreign suppliers in domestic aerospace and satellite programs. In 2025 the group replaced imported components in two major satellite series, delivering ~15% procurement cost savings to those programs. The domestic high-end sensor market is estimated at 150 billion RMB with ~12% annual growth. The company also benefits from a 200 million RMB government grant earmarked for localized high-precision pressure sensor R&D.
Key domestic substitution indicators:
| Indicator | Value |
|---|---|
| High-end sensor market size (China) | 150 billion RMB |
| Market CAGR | ~12% per annum |
| Localization growth rate | ~20% YoY |
| Government grant for sensors | 200M RMB |
| Procurement cost saving (satellite projects) | ~15% |
Growth of smart city infrastructure and Industrial IoT provides recurring service and long-tail revenue opportunities. The IoT division won 12 municipal contracts in 2025 (air quality, smart water), totaling ~400 million RMB in contract value and offering multi-year maintenance and data service streams. Integration of 5G into sensor nodes has improved data throughput/latency by ~40%, enhancing product competitiveness with industrial and municipal customers. The national 'Digital China' initiative targets a ~10% increase in urban IoT density by 2026, supporting sustained demand.
- Municipal contracts (2025): 12 contracts; 400M RMB total
- 5G integration benefit: +40% transmission efficiency
- Digital China mandate: target +10% urban IoT density by 2026
- Revenue model: CapEx hardware + recurring maintenance/service
Strategic partnerships and M&A in the semiconductor space can secure supply and raise margins. In 2025 the group formed a JV with a domestic chipmaker to co-develop automotive ASICs; expected to lower chip procurement costs by ~10% from late 2026. Management has allocated 500 million RMB for targeted M&A of sensor/ASIC startups with IP that complements HOD and MEMS capabilities. Vertical integration through JV/M&A could capture incremental margin across sensing → ASIC → module → system, and reduce supply-chain risk amid global chip shortages.
Planned semiconductor initiatives:
| Initiative | 2025 Status | Expected Impact |
|---|---|---|
| JV with domestic chipmaker | Executed (2025) | -10% chip cost from late 2026 |
| M&A allocation | 500M RMB reserve | Acquire IP; vertical integration |
| Targeted outcomes | ASIC & sensor co-design | Higher ASPs; better margins; supply security |
Prioritized commercial actions to capture opportunities:
- Fast-track HOD adaptation for L3-4 autonomy; secure EV OEM design wins to realize the 800M RMB bid pipeline.
- Scale MEMS production lines for low-altitude platforms; convert drone pilot projects into multi-year supply agreements aiming for the 5% revenue target by 2027.
- Leverage CASC relationships and 200M RMB grant to accelerate import substitution roadmaps for satellite and defense programs.
- Monetize IoT municipal contracts via SaaS/maintenance upsells; expand to Tier 2 cities in 2026-2027 to capture the Digital China mandate uplift.
- Execute targeted M&A and maximize JV outputs to internalize ASIC design and secure a -10% unit cost reduction by late 2026.
Aerospace Hi-Tech Holding Group Co., Ltd. (000901.SZ) - SWOT Analysis: Threats
Intense price competition in the automotive electronics market is compressing margins and threatening market share. Competitors have initiated price cuts of 10-15% across key sensor categories; Aerospace Hi‑Tech lowered quotes for major 2025 contracts, which risks a further gross margin decline of ~200 basis points. Low-cost manufacturers in Southeast Asia and emerging domestic rivals are encroaching on mid‑market product lines. The company must target a 5% annual manufacturing cost reduction to remain competitive despite inflationary headwinds.
- Price cuts by competitors: 10-15% across automotive sensors (2024-2025).
- Estimated margin impact from lowered 2025 quotes: -200 bps gross margin.
- Required manufacturing cost reduction to sustain margins: 5% p.a.
- Risk of occupancy sensor market share loss if technological lead is not maintained: ~5% market share over 12-24 months.
Geopolitical tensions and international trade barriers increase operational and commercial risk, particularly for the Luxembourg‑based IEE subsidiary. New export controls on dual‑use technologies in 2025 affected ~10% of the group's cross‑border component transfers. Potential tariffs on Chinese‑made automotive parts could raise landed costs in Europe by 15-25%, undermining price competitiveness. EU scrutiny under the Foreign Subsidies Regulation threatens eligibility for public tenders and long‑term investments in European facilities.
- Share of cross‑border component transfers affected by export controls (2025): 10%.
- Potential tariff impact on landed cost in Europe: +15-25%.
- Revenue exposure to Europe (approximate): [useful context] significant due to IEE operations and exports.
Rapid technological obsolescence poses a material threat. Sensor lifecycles in certain segments are compressing to 3-5 years. Competitors advancing solid‑state LiDAR and advanced imaging sensors could displace traditional pressure and IR sensors. In 2025 the group recorded an inventory write‑off of RMB 40 million tied to older sensor models. R&D intensity is 6.5% of revenue; yet timely delivery of next‑generation 4D imaging radar is critical to retain NEV contracts.
- Typical technology obsolescence window: 3-5 years.
- Inventory write‑off (2025) related to legacy sensors: RMB 40 million.
- R&D spend: 6.5% of revenue (current fiscal year).
- Potential contract loss risk if 4D imaging radar delayed: material impact on NEV segment revenue (project‑level exposure varies by contract).
Fluctuations in global currency exchange rates create translation and transaction volatility. With ~45% of revenue generated outside China, the group is highly exposed to EUR/RMB and USD/RMB moves. In 2025 a 5% RMB appreciation vs. EUR generated a non‑cash translation loss of RMB 85 million. Hedging covers ~40% of exposure via forward contracts; the remaining ~60% is vulnerable to sudden market shifts and can materially affect consolidated net profit and export competitiveness.
| Metric | Figure / Exposure |
|---|---|
| Revenue outside China | ~45% |
| 2025 translation loss from 5% RMB↑ vs EUR | RMB 85 million (non‑cash) |
| Hedged exposure | ~40% |
| Unhedged exposure | ~60% |
Stringent and evolving environmental and safety regulations increase compliance cost and time‑to‑market risk. Global standards such as REACH and RoHS require continuous process adjustments. New EU carbon border adjustment mechanisms introduced in 2025 added an estimated RMB 30 million to annual compliance costs. More rigorous automotive safety testing extends average time‑to‑market for new products by ~6 months and increases pre‑launch testing expenditures.
- Estimated additional annual compliance cost from EU carbon border mechanisms (2025): RMB 30 million.
- Average increase in time‑to‑market due to stricter testing: ~6 months.
- Regulatory non‑compliance risks: fines, product exclusion from EU market, disqualification from tenders.
| Threat | Key Quantitative Impact | Short‑term Probability |
|---|---|---|
| Intense price competition | -200 bps gross margin risk; 10-15% competitor price cuts | High |
| Geopolitical / trade barriers | 10% of transfers affected; +15-25% landed cost risk in EU | Medium-High |
| Technological obsolescence | RMB 40m inventory write‑off (2025); R&D 6.5% revenue | High |
| Currency volatility | RMB 85m translation loss from 5% RMB↑ vs EUR; 45% revenue exposure | Medium-High |
| Environmental & safety regulations | RMB 30m added annual compliance cost; +6 months time‑to‑market | Medium |
Disclaimer
All information, articles, and product details provided on this website are for general informational and educational purposes only. We do not claim any ownership over, nor do we intend to infringe upon, any trademarks, copyrights, logos, brand names, or other intellectual property mentioned or depicted on this site. Such intellectual property remains the property of its respective owners, and any references here are made solely for identification or informational purposes, without implying any affiliation, endorsement, or partnership.
We make no representations or warranties, express or implied, regarding the accuracy, completeness, or suitability of any content or products presented. Nothing on this website should be construed as legal, tax, investment, financial, medical, or other professional advice. In addition, no part of this site—including articles or product references—constitutes a solicitation, recommendation, endorsement, advertisement, or offer to buy or sell any securities, franchises, or other financial instruments, particularly in jurisdictions where such activity would be unlawful.
All content is of a general nature and may not address the specific circumstances of any individual or entity. It is not a substitute for professional advice or services. Any actions you take based on the information provided here are strictly at your own risk. You accept full responsibility for any decisions or outcomes arising from your use of this website and agree to release us from any liability in connection with your use of, or reliance upon, the content or products found herein.