
|
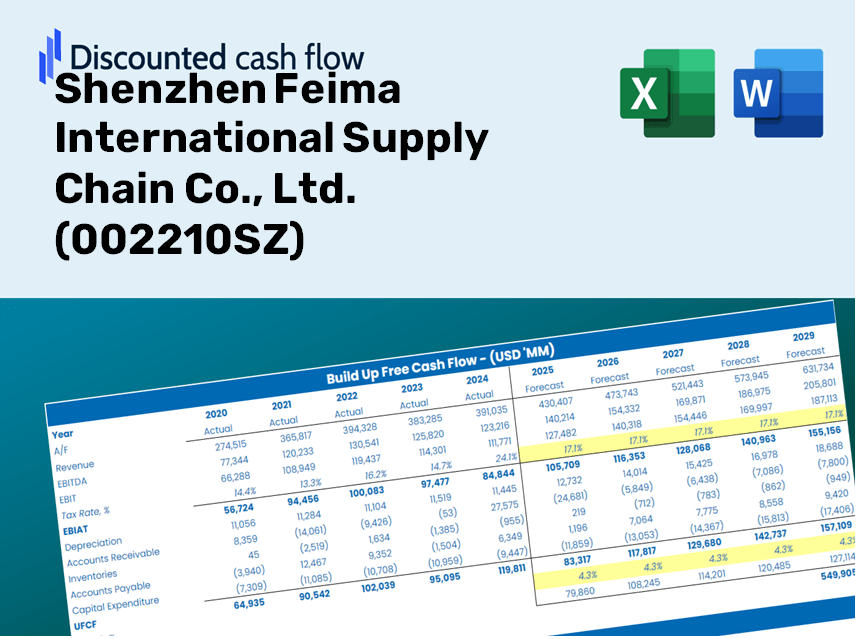
Shenzhen Feima International Supply Chain Co., Ltd. (002210.SZ) DCF Valuation |
Fully Editable: Tailor To Your Needs In Excel Or Sheets
Professional Design: Trusted, Industry-Standard Templates
Investor-Approved Valuation Models
MAC/PC Compatible, Fully Unlocked
No Expertise Is Needed; Easy To Follow
Shenzhen Feima International Supply Chain Co., Ltd. (002210.SZ) Bundle
Simplify Shenzhen Feima International Supply Chain Co., Ltd. (002210SZ) valuation with this customizable DCF Calculator! Featuring real Shenzhen Feima International Supply Chain Co., Ltd. (002210SZ) financials and adjustable forecast inputs, you can test scenarios and uncover Shenzhen Feima International Supply Chain Co., Ltd. (002210SZ) fair value in minutes.
Benefits of Using Our Model
- Flexible Input Adjustments: Modify key assumptions (growth %, margins, WACC) effortlessly to explore various scenarios.
- Current Market Data: Pre-loaded financial information for Shenzhen Feima International Supply Chain Co., Ltd. (002210SZ) to facilitate your analysis.
- Instant DCF Calculations: The model automatically computes Net Present Value (NPV) and intrinsic value for you.
- Tailored and Professional Design: A sleek Excel framework that can be customized to meet your valuation requirements.
- Designed for Investors and Analysts: Perfect for evaluating forecasts, validating business strategies, and enhancing efficiency.
Key Features
- Comprehensive Financial Data: Includes detailed historical financials and future projections for Shenzhen Feima International Supply Chain Co., Ltd. (002210SZ).
- Customizable Input Parameters: Tailor factors such as revenue growth, profit margins, WACC, tax rates, and capital expenditures to suit your analysis.
- Interactive Valuation Model: Automatically recalculates Net Present Value (NPV) and intrinsic value based on your inputs.
- Scenario Analysis: Develop various forecasting scenarios to evaluate potential valuation results.
- Intuitive User Interface: Designed with simplicity in mind, making it accessible for both seasoned professionals and newcomers.
How It Functions
- 1. Access the Template: Download and open the Excel file featuring Shenzhen Feima International Supply Chain Co., Ltd. (002210SZ)'s preloaded data.
- 2. Adjust Assumptions: Modify key variables such as growth rates, WACC, and capital expenditures.
- 3. See Results in Real-Time: The DCF model automatically calculates the intrinsic value and NPV.
- 4. Evaluate Different Scenarios: Analyze various forecasts to explore different valuation results.
- 5. Utilize with Assurance: Present comprehensive valuation insights to back your strategic decisions.
Why Choose Shenzhen Feima International Supply Chain Co., Ltd. (002210SZ)?
- Reliability: Backed by comprehensive data to ensure dependable insights.
- Adaptability: Built for users to easily adjust and experiment with various parameters.
- Efficiency: Eliminate the need to develop a complex supply chain model from the ground up.
- High Standards: Created with the expertise and standards expected by industry leaders.
- Intuitive Interface: Simple to navigate, making it accessible for users with varying levels of experience.
Who Can Benefit from Our Services?
- Supply Chain Managers: Optimize logistics and streamline operations for efficient resource management.
- Business Analysts: Evaluate supply chain scenarios to inform strategic decision-making.
- Consultants and Advisors: Offer clients comprehensive insights into the supply chain capabilities of Shenzhen Feima International (002210SZ).
- Students and Educators: Utilize practical examples to learn and teach supply chain management principles.
- Industry Professionals: Gain a deeper understanding of how companies like Shenzhen Feima International are positioned within the supply chain landscape.
Contents of the Template
- Historical Data: Comprehensive records of Shenzhen Feima’s previous financial performance and baseline forecasts.
- DCF and Levered DCF Models: In-depth templates designed for calculating the intrinsic value of Shenzhen Feima (002210SZ).
- WACC Sheet: Pre-configured calculations for the Weighted Average Cost of Capital.
- Editable Inputs: Customize key metrics such as growth rates, EBITDA percentages, and CAPEX projections.
- Quarterly and Annual Statements: A detailed analysis of Shenzhen Feima’s financial statements.
- Interactive Dashboard: A dynamic tool for visualizing valuation results and forecasts.
Disclaimer
All information, articles, and product details provided on this website are for general informational and educational purposes only. We do not claim any ownership over, nor do we intend to infringe upon, any trademarks, copyrights, logos, brand names, or other intellectual property mentioned or depicted on this site. Such intellectual property remains the property of its respective owners, and any references here are made solely for identification or informational purposes, without implying any affiliation, endorsement, or partnership.
We make no representations or warranties, express or implied, regarding the accuracy, completeness, or suitability of any content or products presented. Nothing on this website should be construed as legal, tax, investment, financial, medical, or other professional advice. In addition, no part of this site—including articles or product references—constitutes a solicitation, recommendation, endorsement, advertisement, or offer to buy or sell any securities, franchises, or other financial instruments, particularly in jurisdictions where such activity would be unlawful.
All content is of a general nature and may not address the specific circumstances of any individual or entity. It is not a substitute for professional advice or services. Any actions you take based on the information provided here are strictly at your own risk. You accept full responsibility for any decisions or outcomes arising from your use of this website and agree to release us from any liability in connection with your use of, or reliance upon, the content or products found herein.