
|
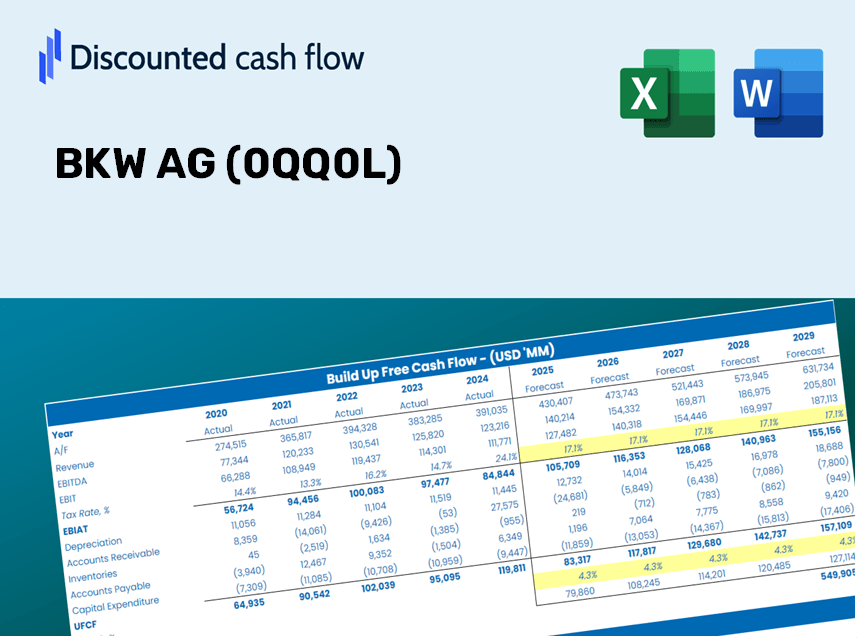
BKW AG (0QQ0.L) DCF Valuation |
Fully Editable: Tailor To Your Needs In Excel Or Sheets
Professional Design: Trusted, Industry-Standard Templates
Investor-Approved Valuation Models
MAC/PC Compatible, Fully Unlocked
No Expertise Is Needed; Easy To Follow
BKW AG (0QQ0.L) Bundle
Explore the financial prospects of BKW AG (0QQ0L) with our user-friendly DCF Calculator! Enter your predictions for growth, margins, and expenses to calculate the intrinsic value of BKW AG (0QQ0L) and refine your investment strategy.
Discounted Cash Flow (DCF) - (USD MM)
| Year | AY1 2020 |
AY2 2021 |
AY3 2022 |
AY4 2023 |
AY5 2024 |
FY1 2025 |
FY2 2026 |
FY3 2027 |
FY4 2028 |
FY5 2029 |
|---|---|---|---|---|---|---|---|---|---|---|
| Revenue | 2,935.7 | 3,380.0 | 5,064.5 | 4,432.7 | 4,548.6 | 5,175.3 | 5,888.3 | 6,699.6 | 7,622.7 | 8,672.9 |
| Revenue Growth, % | 0 | 15.13 | 49.84 | -12.48 | 2.61 | 13.78 | 13.78 | 13.78 | 13.78 | 13.78 |
| EBITDA | 685.8 | 666.2 | 1,062.6 | 886.7 | 1,185.0 | 1,139.7 | 1,296.7 | 1,475.4 | 1,678.6 | 1,909.9 |
| EBITDA, % | 23.36 | 19.71 | 20.98 | 20 | 26.05 | 22.02 | 22.02 | 22.02 | 22.02 | 22.02 |
| Depreciation | 243.0 | 247.2 | 271.3 | 279.9 | 288.3 | 347.8 | 395.7 | 450.2 | 512.3 | 582.8 |
| Depreciation, % | 8.28 | 7.31 | 5.36 | 6.31 | 6.34 | 6.72 | 6.72 | 6.72 | 6.72 | 6.72 |
| EBIT | 442.8 | 419.0 | 791.3 | 606.8 | 896.7 | 791.9 | 901.0 | 1,025.1 | 1,166.4 | 1,327.1 |
| EBIT, % | 15.08 | 12.4 | 15.62 | 13.69 | 19.71 | 15.3 | 15.3 | 15.3 | 15.3 | 15.3 |
| Total Cash | 1,013.9 | 1,020.7 | 837.7 | 915.8 | 1,012.4 | 1,285.5 | 1,462.6 | 1,664.1 | 1,893.4 | 2,154.2 |
| Total Cash, percent | .0 | .0 | .0 | .0 | .0 | .0 | .0 | .0 | .0 | .0 |
| Account Receivables | 954.8 | 1,616.7 | 1,819.6 | 1,083.6 | 1,453.0 | 1,787.3 | 2,033.5 | 2,313.7 | 2,632.5 | 2,995.2 |
| Account Receivables, % | 32.52 | 47.83 | 35.93 | 24.45 | 31.94 | 34.53 | 34.53 | 34.53 | 34.53 | 34.53 |
| Inventories | 66.7 | 93.0 | 211.2 | 210.5 | 347.7 | 223.4 | 254.2 | 289.2 | 329.1 | 374.4 |
| Inventories, % | 2.27 | 2.75 | 4.17 | 4.75 | 7.64 | 4.32 | 4.32 | 4.32 | 4.32 | 4.32 |
| Accounts Payable | 366.0 | 535.0 | 491.1 | 389.0 | 468.7 | 590.7 | 672.1 | 764.7 | 870.1 | 990.0 |
| Accounts Payable, % | 12.47 | 15.83 | 9.7 | 8.78 | 10.3 | 11.41 | 11.41 | 11.41 | 11.41 | 11.41 |
| Capital Expenditure | -220.6 | -244.4 | -258.4 | -354.0 | -452.6 | -391.1 | -445.0 | -506.3 | -576.0 | -655.4 |
| Capital Expenditure, % | -7.51 | -7.23 | -5.1 | -7.99 | -9.95 | -7.56 | -7.56 | -7.56 | -7.56 | -7.56 |
| Tax Rate, % | 24.21 | 24.21 | 24.21 | 24.21 | 24.21 | 24.21 | 24.21 | 24.21 | 24.21 | 24.21 |
| EBITAT | 396.7 | 336.1 | 586.7 | 489.5 | 679.7 | 634.2 | 721.6 | 821.0 | 934.1 | 1,062.8 |
| Depreciation | ||||||||||
| Changes in Account Receivables | ||||||||||
| Changes in Inventories | ||||||||||
| Changes in Accounts Payable | ||||||||||
| Capital Expenditure | ||||||||||
| UFCF | -236.4 | -180.3 | 234.6 | 1,050.0 | 88.5 | 502.9 | 476.7 | 542.3 | 617.1 | 702.1 |
| WACC, % | 4.45 | 4.39 | 4.35 | 4.39 | 4.36 | 4.39 | 4.39 | 4.39 | 4.39 | 4.39 |
| PV UFCF | ||||||||||
| SUM PV UFCF | 2,482.0 | |||||||||
| Long Term Growth Rate, % | 2.00 | |||||||||
| Free cash flow (T + 1) | 716 | |||||||||
| Terminal Value | 29,979 | |||||||||
| Present Terminal Value | 24,186 | |||||||||
| Enterprise Value | 26,668 | |||||||||
| Net Debt | 1,295 | |||||||||
| Equity Value | 25,372 | |||||||||
| Diluted Shares Outstanding, MM | 53 | |||||||||
| Equity Value Per Share | 481.14 |
What You Will Receive
- Customizable Excel Template: An interactive Excel-based DCF Calculator featuring pre-filled financial data for BKW AG (0QQ0L).
- Accurate Data: Comprehensive historical data along with future projections (highlighted in the yellow cells).
- Adjustable Projections: Modify key assumptions such as revenue growth, EBITDA %, and WACC at your convenience.
- Instantaneous Calculations: Quickly visualize how your inputs influence the valuation of BKW AG (0QQ0L).
- Professional Resource: Designed for the needs of investors, CFOs, consultants, and financial analysts.
- Intuitive Layout: Organized for straightforward navigation and usability, complete with detailed instructions.
Key Features
- Advanced DCF Calculator: Features comprehensive unlevered and levered DCF valuation models.
- WACC Calculator: Comes with a pre-configured Weighted Average Cost of Capital sheet that allows for customizable inputs.
- Editable Forecast Assumptions: Easily adjust growth rates, capital expenditures, and discount rates to suit your analysis.
- Built-In Financial Ratios: Evaluate profitability, leverage, and efficiency ratios specifically for BKW AG (0QQ0L).
- Dashboard and Charts: Visual presentations that summarize essential valuation metrics for streamlined analysis.
How It Operates
- Step 1: Download the Excel file for BKW AG (0QQ0L).
- Step 2: Examine the pre-filled financial data and projections for BKW AG (0QQ0L).
- Step 3: Adjust key parameters such as revenue growth, WACC, and tax rates (highlighted cells).
- Step 4: Observe the DCF model refresh in real-time as you modify the assumptions.
- Step 5: Evaluate the outputs and utilize the findings for your investment strategy.
Why Choose This Calculator for BKW AG (0QQ0L)?
- All-in-One Solution: Combines DCF, WACC, and financial ratio analyses into a single tool.
- Flexible Input Options: Modify the cells highlighted in yellow to explore different scenarios.
- In-Depth Analysis: Automatically determines BKW AG's intrinsic value and Net Present Value.
- Ready-to-Use Data: Historical and projected information provides a solid foundation for analysis.
- Expert Level Tool: Perfect for financial analysts, investors, and business advisors.
Who Can Benefit from This Product?
- Investors: Evaluate BKW AG's (0QQ0L) valuation to make informed stock trading decisions.
- CFOs and Financial Analysts: Optimize valuation methodologies and assess future projections for BKW AG (0QQ0L).
- Startup Founders: Gain insights into how established companies like BKW AG (0QQ0L) are valued.
- Consultants: Provide comprehensive valuation reports to your clients using BKW AG's (0QQ0L) data.
- Students and Educators: Utilize real-world data from BKW AG (0QQ0L) to enhance valuation practice and education.
Contents of the Template
- Preloaded BKW AG Data: Historical and projected financial information, covering revenue, EBIT, and capital expenditures.
- DCF and WACC Models: High-quality spreadsheets for determining intrinsic value and calculating Weighted Average Cost of Capital.
- Editable Inputs: Cells highlighted in yellow for easy adjustments to revenue growth, tax rates, and discount rates.
- Financial Statements: Detailed annual and quarterly financial statements for thorough analysis.
- Key Ratios: Metrics for profitability, leverage, and efficiency to assess overall performance.
- Dashboard and Charts: Visual representations of valuation results and underlying assumptions.
Disclaimer
All information, articles, and product details provided on this website are for general informational and educational purposes only. We do not claim any ownership over, nor do we intend to infringe upon, any trademarks, copyrights, logos, brand names, or other intellectual property mentioned or depicted on this site. Such intellectual property remains the property of its respective owners, and any references here are made solely for identification or informational purposes, without implying any affiliation, endorsement, or partnership.
We make no representations or warranties, express or implied, regarding the accuracy, completeness, or suitability of any content or products presented. Nothing on this website should be construed as legal, tax, investment, financial, medical, or other professional advice. In addition, no part of this site—including articles or product references—constitutes a solicitation, recommendation, endorsement, advertisement, or offer to buy or sell any securities, franchises, or other financial instruments, particularly in jurisdictions where such activity would be unlawful.
All content is of a general nature and may not address the specific circumstances of any individual or entity. It is not a substitute for professional advice or services. Any actions you take based on the information provided here are strictly at your own risk. You accept full responsibility for any decisions or outcomes arising from your use of this website and agree to release us from any liability in connection with your use of, or reliance upon, the content or products found herein.