
|
CSPC Pharmaceutical Group Limited (1093.HK) DCF Valuation |
Fully Editable: Tailor To Your Needs In Excel Or Sheets
Professional Design: Trusted, Industry-Standard Templates
Investor-Approved Valuation Models
MAC/PC Compatible, Fully Unlocked
No Expertise Is Needed; Easy To Follow
CSPC Pharmaceutical Group Limited (1093.HK) Bundle
Gain insight into your CSPC Pharmaceutical Group Limited (1093HK) valuation analysis with our state-of-the-art DCF Calculator! Equipped with real (1093HK) data, this Excel template enables you to adjust forecasts and assumptions to accurately determine the intrinsic value of CSPC Pharmaceutical Group Limited.
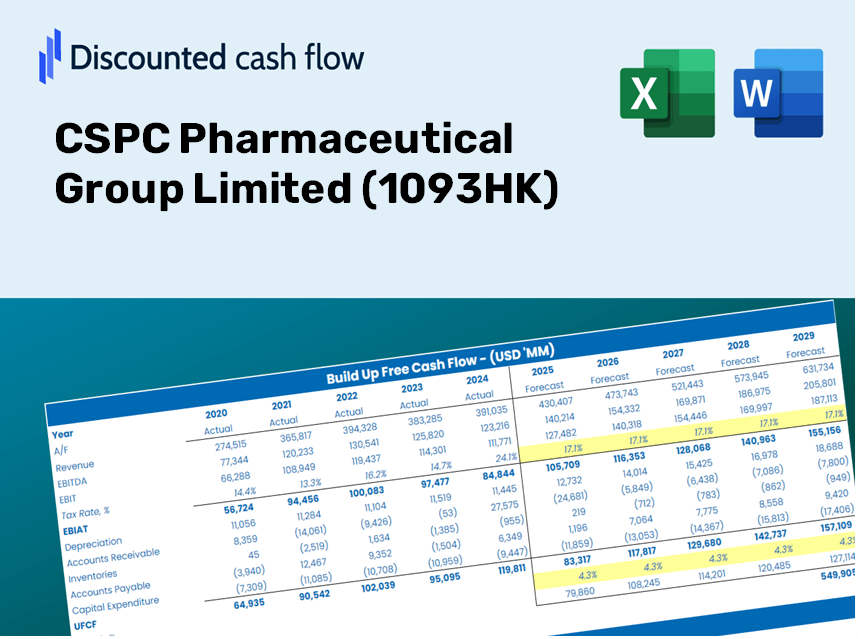
Discounted Cash Flow (DCF) - (USD MM)
| Year | AY1 2020 |
AY2 2021 |
AY3 2022 |
AY4 2023 |
AY5 2024 |
FY1 2025 |
FY2 2026 |
FY3 2027 |
FY4 2028 |
FY5 2029 |
|---|---|---|---|---|---|---|---|---|---|---|
| Revenue | 25,763.0 | 29,942.2 | 34,513.6 | 34,382.9 | 32,273.8 | 34,289.0 | 36,430.1 | 38,704.8 | 41,121.6 | 43,689.2 |
| Revenue Growth, % | 0 | 16.22 | 15.27 | -0.37853 | -6.13 | 6.24 | 6.24 | 6.24 | 6.24 | 6.24 |
| EBITDA | 7,433.6 | 8,269.2 | 9,670.5 | 9,384.1 | 7,841.2 | 9,332.1 | 9,914.8 | 10,533.8 | 11,191.6 | 11,890.4 |
| EBITDA, % | 28.85 | 27.62 | 28.02 | 27.29 | 24.3 | 27.22 | 27.22 | 27.22 | 27.22 | 27.22 |
| Depreciation | 833.6 | 928.1 | 1,166.7 | 1,218.1 | 1,486.5 | 1,225.1 | 1,301.6 | 1,382.9 | 1,469.2 | 1,561.0 |
| Depreciation, % | 3.24 | 3.1 | 3.38 | 3.54 | 4.61 | 3.57 | 3.57 | 3.57 | 3.57 | 3.57 |
| EBIT | 6,600.0 | 7,341.1 | 8,503.8 | 8,166.0 | 6,354.7 | 8,106.9 | 8,613.1 | 9,151.0 | 9,722.4 | 10,329.4 |
| EBIT, % | 25.62 | 24.52 | 24.64 | 23.75 | 19.69 | 23.64 | 23.64 | 23.64 | 23.64 | 23.64 |
| Total Cash | 11,439.6 | 15,156.2 | 15,156.6 | 14,303.8 | 9,013.8 | 14,296.3 | 15,188.9 | 16,137.3 | 17,145.0 | 18,215.5 |
| Total Cash, percent | .0 | .0 | .0 | .0 | .0 | .0 | .0 | .0 | .0 | .0 |
| Account Receivables | 6,320.0 | 8,723.7 | 8,226.2 | 11,838.1 | 10,858.1 | 9,983.3 | 10,606.6 | 11,268.9 | 11,972.5 | 12,720.1 |
| Account Receivables, % | 24.53 | 29.14 | 23.83 | 34.43 | 33.64 | 29.12 | 29.12 | 29.12 | 29.12 | 29.12 |
| Inventories | 2,410.7 | 3,314.9 | 2,791.3 | 3,429.1 | 3,639.2 | 3,412.8 | 3,625.9 | 3,852.3 | 4,092.9 | 4,348.4 |
| Inventories, % | 9.36 | 11.07 | 8.09 | 9.97 | 11.28 | 9.95 | 9.95 | 9.95 | 9.95 | 9.95 |
| Accounts Payable | 1,608.3 | 1,772.8 | 2,196.1 | 3,104.7 | 2,854.8 | 2,496.3 | 2,652.2 | 2,817.8 | 2,993.8 | 3,180.7 |
| Accounts Payable, % | 6.24 | 5.92 | 6.36 | 9.03 | 8.85 | 7.28 | 7.28 | 7.28 | 7.28 | 7.28 |
| Capital Expenditure | -1,903.4 | -1,868.8 | -2,843.6 | -2,068.2 | -2,926.8 | -2,534.1 | -2,692.4 | -2,860.5 | -3,039.1 | -3,228.8 |
| Capital Expenditure, % | -7.39 | -6.24 | -8.24 | -6.02 | -9.07 | -7.39 | -7.39 | -7.39 | -7.39 | -7.39 |
| Tax Rate, % | 22.42 | 22.42 | 22.42 | 22.42 | 22.42 | 22.42 | 22.42 | 22.42 | 22.42 | 22.42 |
| EBITAT | 5,328.4 | 6,009.6 | 6,831.7 | 6,490.6 | 4,930.0 | 6,485.5 | 6,890.5 | 7,320.7 | 7,777.8 | 8,263.5 |
| Depreciation | ||||||||||
| Changes in Account Receivables | ||||||||||
| Changes in Inventories | ||||||||||
| Changes in Accounts Payable | ||||||||||
| Capital Expenditure | ||||||||||
| UFCF | -2,863.9 | 1,925.5 | 6,599.4 | 2,299.4 | 4,009.7 | 5,919.3 | 4,819.1 | 5,120.0 | 5,439.7 | 5,779.4 |
| WACC, % | 7.78 | 7.79 | 7.78 | 7.78 | 7.78 | 7.78 | 7.78 | 7.78 | 7.78 | 7.78 |
| PV UFCF | ||||||||||
| SUM PV UFCF | 21,732.2 | |||||||||
| Long Term Growth Rate, % | 1.00 | |||||||||
| Free cash flow (T + 1) | 5,837 | |||||||||
| Terminal Value | 86,039 | |||||||||
| Present Terminal Value | 59,145 | |||||||||
| Enterprise Value | 80,877 | |||||||||
| Net Debt | -6,850 | |||||||||
| Equity Value | 87,727 | |||||||||
| Diluted Shares Outstanding, MM | 11,738 | |||||||||
| Equity Value Per Share | 7.47 |
What You Will Receive
- Pre-Filled Financial Model: Leverage CSPC Pharmaceutical Group Limited's (1093HK) actual data for accurate DCF valuation.
- Comprehensive Forecast Control: Modify key parameters such as revenue growth, profit margins, WACC, and more.
- Real-Time Calculations: Automatic updates provide immediate feedback as you adjust inputs.
- Professional-Grade Template: A polished Excel file crafted for investment-level valuations.
- Flexible and Reusable: Designed for adaptability, perfect for ongoing detailed forecasts.
Key Features
- Real-Life CSPC Data: Pre-loaded with CSPC Pharmaceutical Group Limited's historical financial performance and future projections.
- Fully Customizable Inputs: Modify revenue growth rates, profit margins, WACC, tax rates, and capital expenditures as needed.
- Dynamic Valuation Model: Automatically refreshes Net Present Value (NPV) and intrinsic value based on your personalized inputs.
- Scenario Testing: Develop various forecasting scenarios to evaluate different valuation outcomes.
- User-Friendly Design: Intuitive and structured interface suitable for both professionals and beginners.
How It Works
- Step 1: Download the Excel file.
- Step 2: Examine CSPC Pharmaceutical Group Limited's (1093HK) pre-filled financial data and projections.
- Step 3: Adjust key inputs such as revenue growth, WACC, and tax rates (highlighted cells).
- Step 4: Observe the DCF model refresh immediately as you alter the assumptions.
- Step 5: Evaluate the outputs and leverage the results for your investment strategies.
Why Choose This Calculator for CSPC Pharmaceutical Group Limited (1093HK)?
- Accuracy: Up-to-date financial data from CSPC guarantees reliable results.
- Flexibility: Tailored for users to experiment with and adjust inputs as needed.
- Time-Saving: Avoid the complexities of constructing a DCF model from the ground up.
- Professional-Grade: Crafted with precision and usability that meets CFO standards.
- User-Friendly: Intuitive design makes it accessible for those without extensive financial modeling skills.
Who Can Benefit from This Product?
- Investors: Effectively assess the fair value of CSPC Pharmaceutical Group Limited (1093HK) prior to making investment choices.
- CFOs: Utilize a professional-grade DCF model for accurate financial reporting and analysis.
- Consultants: Seamlessly customize the template for client valuation reports.
- Entrepreneurs: Discover financial modeling insights employed by leading pharmaceutical companies.
- Educators: Implement it as a teaching tool to illustrate various valuation methodologies.
Contents of the Template
- Pre-Populated Data: Features CSPC Pharmaceutical Group Limited's historical financial performance and forecasts.
- Discounted Cash Flow Model: An editable DCF valuation model equipped with automatic calculations.
- Weighted Average Cost of Capital (WACC): A specific sheet for determining WACC based on your customized inputs.
- Essential Financial Ratios: Evaluate CSPC’s profitability, operational efficiency, and financial leverage.
- Customizable Variables: Effortlessly modify revenue growth rates, margins, and tax percentages.
- Concise Dashboard: Visuals and tables summarizing primary valuation outcomes.
Disclaimer
All information, articles, and product details provided on this website are for general informational and educational purposes only. We do not claim any ownership over, nor do we intend to infringe upon, any trademarks, copyrights, logos, brand names, or other intellectual property mentioned or depicted on this site. Such intellectual property remains the property of its respective owners, and any references here are made solely for identification or informational purposes, without implying any affiliation, endorsement, or partnership.
We make no representations or warranties, express or implied, regarding the accuracy, completeness, or suitability of any content or products presented. Nothing on this website should be construed as legal, tax, investment, financial, medical, or other professional advice. In addition, no part of this site—including articles or product references—constitutes a solicitation, recommendation, endorsement, advertisement, or offer to buy or sell any securities, franchises, or other financial instruments, particularly in jurisdictions where such activity would be unlawful.
All content is of a general nature and may not address the specific circumstances of any individual or entity. It is not a substitute for professional advice or services. Any actions you take based on the information provided here are strictly at your own risk. You accept full responsibility for any decisions or outcomes arising from your use of this website and agree to release us from any liability in connection with your use of, or reliance upon, the content or products found herein.