
|
BYD Company Limited (1211.HK): Porter's 5 Forces Analysis |
Fully Editable: Tailor To Your Needs In Excel Or Sheets
Professional Design: Trusted, Industry-Standard Templates
Investor-Approved Valuation Models
MAC/PC Compatible, Fully Unlocked
No Expertise Is Needed; Easy To Follow
BYD Company Limited (1211.HK) Bundle
As the electric vehicle market accelerates, understanding the competitive landscape becomes crucial for stakeholders. BYD Company Limited, a leader in this dynamic field, faces unique challenges and opportunities shaped by Michael Porter’s Five Forces. From supplier dynamics to customer leverage, the intricacies of competition and potential threats paint a vivid picture of the automotive future. Dive deeper to uncover how these forces interact and influence BYD's strategic maneuvers in the electrifying world of sustainable transport.
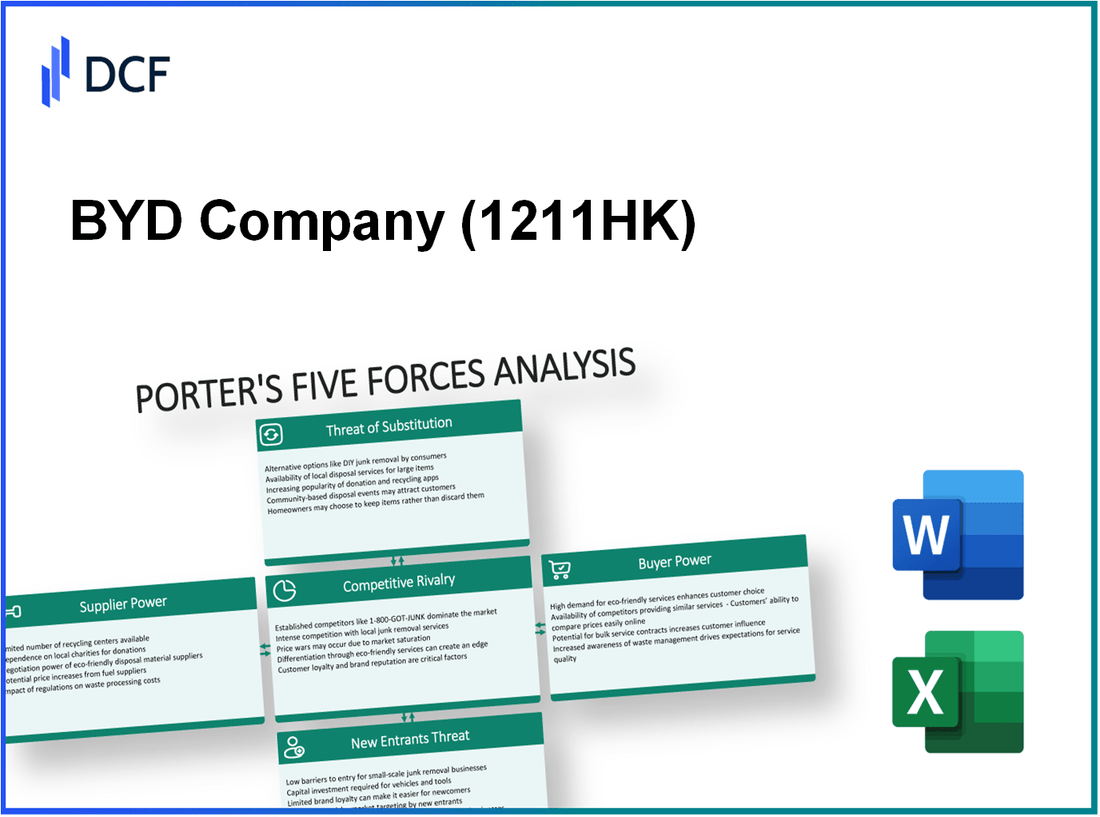
BYD Company Limited - Porter's Five Forces: Bargaining power of suppliers
BYD Company Limited, a major player in the electric vehicle (EV) and battery manufacturing sectors, is significantly reliant on raw materials, particularly lithium. As of 2023, lithium prices have fluctuated, with average prices around $73,000 per metric ton during the first quarter, showcasing the volatility that can impact supplier power.
Despite this reliance, BYD has established a large network of suppliers, which helps mitigate risks associated with dependence on any single source. This diversified supply chain approach enables BYD to source materials from various suppliers across different regions, reducing the overall bargaining power of individual suppliers.
In line with this strategy, BYD has developed strategic partnerships with key suppliers. Notable collaborations include a long-term agreement with lithium supplier Ganfeng Lithium, allowing BYD to secure materials at competitive prices. This relationship enhances BYD's negotiation power, ensuring favorable terms and stability in sourcing essential components.
Technological advancements in battery production and electric vehicles heighten BYD's dependency on specific suppliers for specialized components. For instance, the push for higher battery efficiency and longer ranges requires advanced materials that only certain suppliers can provide, increasing their bargaining power. This dependency reflects a growing trend in the EV industry where innovation directly impacts supplier negotiations.
However, BYD benefits from significant economies of scale due to its large production volumes. In 2022, BYD reported total revenue of ¥424.84 billion (approximately $61.3 billion), allowing the company to negotiate better pricing on bulk material purchases. This financial strength reduces the influence of individual suppliers, as BYD's large orders can command lower prices.
| Material | 2022 Price per Metric Ton (USD) | Current Price per Metric Ton (USD) | Price Change (%) |
|---|---|---|---|
| Lithium | $25,000 | $73,000 | 192% |
| Cobalt | $32,000 | $42,000 | 31% |
| Nickel | $20,000 | $29,000 | 45% |
The bargaining power of suppliers in BYD's context is multifaceted. While certain raw materials show increasing prices which could empower suppliers, BYD's strong supplier network and strategic partnerships significantly buffer the company against drastic price increases. Moreover, advancements in technology imply a necessary reliance on select suppliers, yet BYD's economies of scale remain a critical factor in diminishing supplier influence.
BYD Company Limited - Porter's Five Forces: Bargaining power of customers
The bargaining power of customers for BYD Company Limited is influenced by various factors that shape the electric vehicle (EV) market and consumer behavior.
Diverse customer base from individuals to large commercial clients
BYD services a wide-ranging customer base, including individual consumers, fleet operators, and large commercial entities. In 2022, BYD delivered over 1.86 million vehicles, showcasing its strong appeal across different market segments. This diversity dilutes individual customer power since no single segment can significantly influence pricing.
Increasing demand for electric vehicles enhances leverage
The global EV market is experiencing rapid growth, projected to expand at a compound annual growth rate (CAGR) of 22.6% from 2023 to 2030. As of 2023, BYD holds a market share of approximately 14% in the global EV market, which further enhances customer leverage due to the high demand for sustainable transportation solutions.
Price sensitivity varies across segments
Different customer segments exhibit varying levels of price sensitivity. For instance, individual consumers often rely on government incentives, such as tax credits, which can significantly affect their purchasing decisions. In the United States, the federal tax credit for EVs can be as high as $7,500, impacting overall customer willingness to pay. Conversely, commercial clients may prioritize fleet efficiency over initial pricing, leading to decreased price sensitivity in that segment.
Brand reputation affects customer loyalty
Customer loyalty in the EV sector heavily relies on brand reputation. BYD, being among the top players in EV production, has cultivated a strong brand image. According to consumer reports, BYD’s reputation for reliability and performance positions it favorably against competitors like Tesla and Nissan. In a 2023 survey, 85% of BYD customers indicated they would consider purchasing from the brand again, highlighting robust customer loyalty.
Government incentives influence purchasing decisions
Government policies and incentives are critical in shaping customer behavior. In China, subsidies for new energy vehicles (NEVs) have been significant, with the government providing around $2.9 billion in 2022 to promote EV adoption. This has increased the attractiveness of BYD vehicles, which are often eligible for such incentives. Furthermore, the European Union has set ambitious targets for EV adoption, aiming for 55% of new car sales to be electric by 2030, which will likely further boost demand.
| Segment | Estimated Deliveries (2022) | Price Sensitivity | Customer Loyalty (%) | Government Incentive (USD) |
|---|---|---|---|---|
| Individual Consumers | 1,200,000 | High | 85 | 7,500 |
| Commercial Clients | 660,000 | Moderate | 75 | N/A |
| Government Fleets | 200,000 | Low | 90 | 2,000 |
The table illustrates the distribution of deliveries across various segments, showcasing both estimated volumes and customer characteristics. Understanding these dynamics provides clarity on the overall bargaining power of customers in relation to BYD.
BYD Company Limited - Porter's Five Forces: Competitive rivalry
The competitive landscape for BYD Company Limited is characterized by several critical dynamics that shape its market position in the automotive industry.
High competition from established automotive brands
BYD faces intense competition from established automotive brands such as Tesla, General Motors, Volkswagen, and Nissan. As of 2023, Tesla holds a market share of approximately 16% in the global electric vehicle (EV) market, while BYD has captured around 15%. Volkswagen follows closely with a market share of around 12%.
Rapid innovation pace in electric vehicle sector
The electric vehicle sector is experiencing rapid innovation, with companies investing heavily in research and development. In 2022, BYD allocated $1.5 billion to R&D, a significant increase from $1.1 billion in 2021. This investment is part of a broader industry trend, with the global EV market expected to reach $1.5 trillion by 2027, growing at a CAGR of 18% from 2020 to 2027.
Market share battles in China and internationally
In China, BYD leads with a market share of approximately 30% in the EV segment, outperforming its closest competitor, Tesla, which commands about 12%. Internationally, BYD is expanding its presence, with plans to enter markets like Europe and Latin America. In 2023, BYD reported a 202% increase in EV exports year-over-year, emphasizing its growing footprint outside China.
Differentiation through technology and design
BYD differentiates itself through its technological advancements and innovative design. The company’s Blade Battery technology improves safety and energy density, holding a significant competitive edge. As of 2023, BYD’s energy density reached 180 Wh/kg, outperforming many competitors like Tesla, which is at approximately 160 Wh/kg for its 4680 battery cells. Additionally, BYD has introduced models like the Han EV and Dolphin, which have received accolades for their design and performance.
Collaborations and joint ventures intensify competition
Strategic collaborations and joint ventures further intensify competition in this space. For instance, BYD partnered with Toyota in 2020 to develop electric vehicles, pooling resources and expertise. Meanwhile, BYD’s collaboration with Mercedes-Benz aims to enhance luxury EV offerings. In 2023, these collaborations are expected to increase BYD’s R&D capabilities and market reach, with projected revenue from joint ventures reaching $2 billion by 2025.
| Company | Market Share (2023) | R&D Investment (2022) | Global EV Market Growth (CAGR 2020-2027) | EV Exports Growth (YoY 2023) |
|---|---|---|---|---|
| BYD | 15% | $1.5 billion | 18% | 202% |
| Tesla | 16% | N/A | N/A | N/A |
| Volkswagen | 12% | N/A | N/A | N/A |
| General Motors | N/A | N/A | N/A | N/A |
| Nissan | N/A | N/A | N/A | N/A |
This competitive rivalry analysis illustrates BYD's strategic positioning amidst fierce competition, rapid innovation, and evolving market demands.
BYD Company Limited - Porter's Five Forces: Threat of substitutes
The threat of substitutes for BYD Company Limited involves various alternative transportation options that consumers might consider in response to pricing or evolving market dynamics.
Alternative fuel vehicles like hydrogen or hybrid
BYD faces competition from alternative fuel vehicles, particularly hydrogen fuel cell and hybrid models. In 2022, the global hydrogen vehicle market was valued at approximately $1.88 billion, projected to grow at a compound annual growth rate (CAGR) of 33.5% from 2023 to 2030. This growth indicates a robust interest in hydrogen technologies, which may challenge BYD's dominance in the electric vehicle (EV) sector.
Public transportation as an alternative
Public transportation systems serve as a crucial substitute. In 2020, worldwide public transit ridership dropped by nearly 50% due to the COVID-19 pandemic but was recovering rapidly, with some cities reporting ridership increases of 20% to 30% in 2022. The availability of electric buses, such as those manufactured by BYD, plays a significant role in expanding public transport options.
Growing bicycle and scooter sharing services
The micromobility trend is reshaping urban transportation, with bike and scooter-sharing services gaining traction. In 2021, the global bike-sharing market was valued at approximately $4.62 billion, and it is expected to grow at a CAGR of 21.2% from 2022 to 2030. This developing sector presents a viable alternative for consumers, primarily in dense urban environments.
Consumer shift towards ridesharing or carpooling
Ridesharing services, such as Uber and Lyft, have seen significant adoption. As of 2022, Uber reported revenues of approximately $31.88 billion, indicating strong consumer preference for shared rides over personal vehicle ownership. The proliferation of these services diminishes the attractiveness of individual car purchases, including BYD's offerings.
Emerging battery technologies affecting vehicle choices
Innovations in battery technology, particularly those extending the range and reducing costs of electric vehicles, pose a substantial threat. For instance, solid-state batteries are projected to reduce costs to as low as $100/kWh by 2025. This shift may enhance competition from other manufacturers who adopt these technologies, potentially impacting BYD's market share.
| Substitute Type | Market Value (2022) | Projected CAGR |
|---|---|---|
| Hydrogen Vehicles | $1.88 billion | 33.5% |
| Public Transportation | Recovering (20%-30% increase in ridership) | N/A |
| Bike Sharing | $4.62 billion | 21.2% |
| Ridesharing (Uber Revenue) | $31.88 billion | N/A |
| Solid-State Batteries | $100/kWh (by 2025) | N/A |
BYD Company Limited - Porter's Five Forces: Threat of new entrants
The automotive industry, particularly the electric vehicle (EV) segment, has seen a surge in profitability, prompting new players to consider entry. However, several barriers exist that challenge potential new entrants to BYD Company Limited, a leader in this market.
High capital investment deters new entrants
Entering the automotive market requires significant capital investment. According to Statista, the average cost to develop a new EV platform can exceed $1 billion, factoring in R&D, manufacturing, and supply chain logistics. BYD, with a market cap of approximately $103 billion as of October 2023, benefits from its historical investments and established infrastructure.
Established brand recognition necessary
Brand equity plays a vital role in consumer choices. BYD reported a revenue of ¥182.5 billion (approximately $26.9 billion) in 2022, with a strong brand presence particularly in China, the largest EV market globally. New entrants must invest heavily in marketing to achieve a comparable level of recognition, which can take years and substantial funding.
Regulatory barriers and compliance costs
Compliance with regulatory standards for emissions and safety can create substantial entry barriers. For instance, in China, new energy vehicle manufacturers must adhere to stringent standards set by the Ministry of Industry and Information Technology (MIIT). The Electric Vehicle Initiative (EVI) reported that compliance costs can reach 10% to 15% of total operational expenses for new entrants, making market entry financially daunting.
Technological expertise and intellectual property protection critical
Innovation is crucial in the automotive sector, especially regarding EV technology. BYD has invested approximately $1.5 billion in R&D annually, fostering innovation in battery technology and electric drivetrains. New entrants would need to either develop similar expertise or risk violating existing intellectual property, which could involve legal challenges and costs associated with technology licensing.
Economies of scale give incumbents a competitive edge
BYD's production and distribution efficiencies provide it with a significant cost advantage. For example, BYD reported a production capacity of over 1 million vehicles annually, which allows it to spread fixed costs over a larger output, decreasing per-unit costs. In contrast, new entrants typically start with limited production, potentially facing costs that are 20% to 30% higher per vehicle until they achieve scale.
| Barrier to Entry | Description | Associated Cost/Investment |
|---|---|---|
| Capital Investment | Cost to develop an EV platform | $1 billion+ |
| Brand Recognition | Revenue reported by BYD in 2022 | ¥182.5 billion (~$26.9 billion) |
| Regulatory Compliance | Percentage of operational costs for compliance | 10%-15% |
| R&D Investment | Annual R&D investment by BYD | $1.5 billion |
| Economies of Scale | Annual production capacity of BYD | 1 million vehicles |
Understanding the dynamics of Porter’s Five Forces in the context of BYD Company Limited provides invaluable insights into the challenges and opportunities this electric vehicle manufacturer faces. From navigating supplier relationships and customer demands to fending off competition and threats from substitutes, BYD's strategic positioning and operational adaptability will play crucial roles in its continued success in a rapidly evolving market.
[right_small]Disclaimer
All information, articles, and product details provided on this website are for general informational and educational purposes only. We do not claim any ownership over, nor do we intend to infringe upon, any trademarks, copyrights, logos, brand names, or other intellectual property mentioned or depicted on this site. Such intellectual property remains the property of its respective owners, and any references here are made solely for identification or informational purposes, without implying any affiliation, endorsement, or partnership.
We make no representations or warranties, express or implied, regarding the accuracy, completeness, or suitability of any content or products presented. Nothing on this website should be construed as legal, tax, investment, financial, medical, or other professional advice. In addition, no part of this site—including articles or product references—constitutes a solicitation, recommendation, endorsement, advertisement, or offer to buy or sell any securities, franchises, or other financial instruments, particularly in jurisdictions where such activity would be unlawful.
All content is of a general nature and may not address the specific circumstances of any individual or entity. It is not a substitute for professional advice or services. Any actions you take based on the information provided here are strictly at your own risk. You accept full responsibility for any decisions or outcomes arising from your use of this website and agree to release us from any liability in connection with your use of, or reliance upon, the content or products found herein.