
|
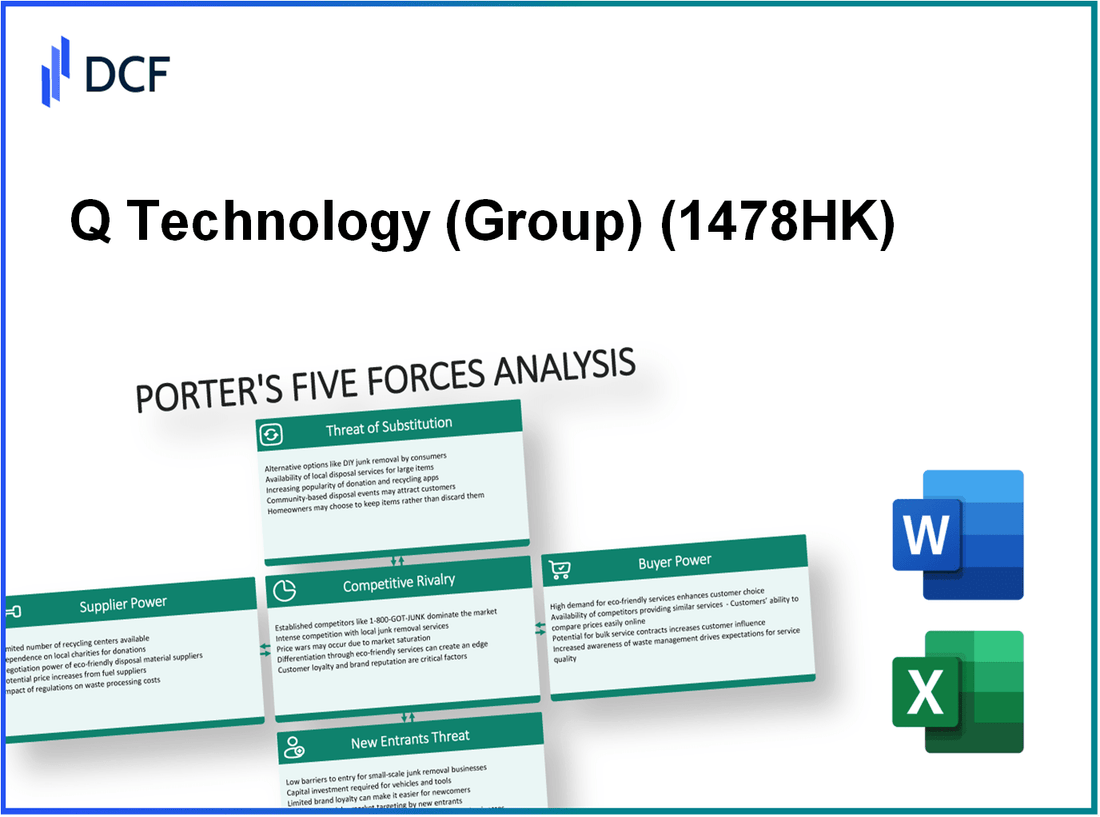
Q Technology Company Limited (1478.HK): Porter's 5 Forces Analysis |
Fully Editable: Tailor To Your Needs In Excel Or Sheets
Professional Design: Trusted, Industry-Standard Templates
Investor-Approved Valuation Models
MAC/PC Compatible, Fully Unlocked
No Expertise Is Needed; Easy To Follow
Q Technology (Group) Company Limited (1478.HK) Bundle
In today's fast-paced tech landscape, understanding the dynamics of competition is crucial for success. Q Technology (Group) Company Limited navigates a complex web of market forces that shape its business environment. From the bargaining power of suppliers and customers to the ever-present threat of new entrants and substitutes, these factors significantly influence profitability and strategy. Dive into the intricate details of Michael Porter’s Five Forces Framework as we explore how they impact Q Technology's position in the industry.
Q Technology (Group) Company Limited - Porter's Five Forces: Bargaining power of suppliers
The bargaining power of suppliers for Q Technology (Group) Company Limited is influenced by several key factors that shape their pricing strategies and overall impact on the company’s operations.
High reliance on specific component suppliers
Q Technology is significantly dependent on a select group of suppliers for critical components, particularly in the semiconductor sector. As of 2023, approximately 60% of its electronic components are sourced from five major suppliers. This concentration increases the vulnerability to price hikes initiated by these suppliers.
Limited number of suppliers for key materials
The nature of Q Technology's business requires specific materials such as advanced substrates and specialized silicon. There are only a handful of suppliers globally, limiting Q Technology's negotiating power. For instance, suppliers for advanced chip packaging materials are limited, with only three key players operating in this space. This scarcity enhances the suppliers' leverage in pricing negotiations.
Suppliers with unique technology offerings
Many of Q Technology’s suppliers possess proprietary technologies vital for their products. About 25% of suppliers have patented technologies, giving them significant pricing power. This reliance on differentiated and unique supplier offerings further diminishes Q Technology's ability to switch suppliers without incurring significant costs.
Potential for supplier price leverage
Given the concentrated supplier base and the specialized nature of materials, a price increase from suppliers could have a substantial impact. Recent trends indicate that semiconductor prices have risen by an average of 15% in the last 12 months. This rise is attributed to supply chain constraints and increased demand, which allows suppliers more leverage in negotiations.
Long-term contracts may mitigate power
To counterbalance supplier power, Q Technology has entered into long-term contracts with some key suppliers. As of the latest reports, approximately 40% of all supplier agreements are locked in for more than three years. These contracts provide price stability and lessen the immediate impact of potential price increases. However, they may also restrict Q Technology's flexibility to leverage market fluctuations.
| Supplier Type | Number of Suppliers | Market Share (%) | Price Increase YTD (%) | Contract Duration (% over 3 years) |
|---|---|---|---|---|
| Electronic Components | 5 | 60 | 15 | 40 |
| Advanced Chip Packaging Materials | 3 | 25 | 15 | 35 |
| Proprietary Technologies | 10 | 25 | 10 | 20 |
This information highlights the complex dynamics between Q Technology and its suppliers, illustrating the significant influence suppliers have over pricing and availability of critical components necessary for the company’s operations.
Q Technology (Group) Company Limited - Porter's Five Forces: Bargaining power of customers
The bargaining power of customers for Q Technology (Group) Company Limited significantly impacts its business strategy and profitability. Key factors influencing this power include the presence of large tech companies as customers, demand for high-quality products at low prices, ease of switching to competitor products, buyer concentration in specific markets, and direct negotiation power due to bulk purchasing.
Presence of large tech companies as key customers
Q Technology has established partnerships with several major tech firms, including Apple Inc. and Xiaomi Corp. In FY 2022, approximately 47% of Q Technology's total revenue was derived from sales to Apple, underscoring the influence of large buyers in its supply chain. This heavy reliance heightens the bargaining power of these customers as they can negotiate for better pricing and terms.
Customer demand for high quality and low prices
Consumers, fueled by competitive tech markets, demand superior product quality along with competitive pricing. For instance, in the smartphone component market, 82% of surveyed customers indicated that product quality directly influences their purchasing decisions, with 65% prioritizing price over brand loyalty. Such dynamics compel Q Technology to consistently improve product standards while keeping costs down.
Easy switching to competitors' products
The technology sector is characterized by rapid innovation, allowing customers to switch easily between suppliers. Reports indicate that over 60% of buyers consider alternative brands within a month of unsatisfactory service or product performance. This ease of switching increases the pressure on Q Technology to offer compelling value propositions to retain customer loyalty.
High buyer concentration in certain markets
In markets such as smartphone manufacturing, buyer concentration is significant. For instance, in China, the top three OEM customers account for over 70% of the total market. Q Technology’s dependency on a few key clients in these concentrated markets amplifies their leverage, as losing even one major client can substantially impact revenue.
Direct negotiation power due to bulk purchasing
Large-scale customers often wield considerable negotiation power due to their bulk purchasing capabilities. For example, in 2022, bulk orders from major clients helped Q Technology achieve a 10% decrease in per-unit costs, which highlights how customer scale can influence supplier pricing structures. This trend is prevalent in industries where large orders can dictate supplier margins and negotiation leverage.
| Factor | Data/Statistics | Impact on Q Technology |
|---|---|---|
| Revenue from Largest Customer (Apple) | 47% of total revenue (FY 2022) | High dependency increases buyer power |
| Customer Preference for Quality | 82% of customers value product quality | Pressures Q Technology to maintain high standards |
| Switching Likelihood to Competitors | 60% of customers consider alternatives within a month | Increases competition and negotiation pressure |
| Market Concentration | Top 3 OEMs in China 70% of total market | Higher leverage for few large buyers |
| Bulk Order Impact on Costs | 10% decrease in per-unit costs from bulk orders | Strengthens buyer negotiation power |
Q Technology (Group) Company Limited - Porter's Five Forces: Competitive rivalry
The competitive landscape for Q Technology (Group) Company Limited reflects a significant intensity driven by various factors. The company operates within the semiconductor industry and faces a multitude of established competitors.
Intense competition from established industry players
Q Technology competes against several notable companies including Qualcomm, MediaTek, and Samsung Electronics. According to the latest financial reports in 2023:
- Qualcomm's revenue reached approximately $44.2 billion.
- MediaTek reported revenues of around $18.8 billion.
- Samsung Electronics generated around $236 billion in semiconductor sales alone.
Rapid technological advancements
The semiconductor industry is characterized by rapid innovation. For instance, the global market for semiconductors is projected to grow from $600 billion in 2021 to approximately $1 trillion by 2030, showcasing a compound annual growth rate (CAGR) of about 7.8%.
High R&D investment by competitors
Companies within this sector invest heavily in research and development to maintain competitive edges. In 2022, the R&D expenditure for key competitors was as follows:
| Company | R&D Expenditure (2022) |
|---|---|
| Qualcomm | $10.4 billion |
| MediaTek | $2.4 billion |
| Samsung Electronics | $22.4 billion |
This level of investment underscores the pressure on Q Technology to innovate and keep pace with industry advancements.
Competitive pricing strategies prevalent
Pricing strategies in the semiconductor market are increasingly competitive. As of 2023, companies have been engaging in aggressive pricing to capture market share. For instance, Q Technology’s pricing for mobile chips has been reported to be 15% lower than some competitors, making it a more attractive option for cost-sensitive manufacturers.
Brand loyalty can affect rivalry dynamics
Brand loyalty significantly influences consumer preferences in the technology sector. As of mid-2023, studies indicate that 70% of consumers in Asia prefer established brands like Qualcomm and Samsung for reliability, impacting Q Technology’s ability to expand its market share.
In conclusion, the competitive rivalry faced by Q Technology (Group) Company Limited is marked by established competitors, continuous technological innovation, significant R&D investments, aggressive pricing strategies, and the substantial influence of brand loyalty.
Q Technology (Group) Company Limited - Porter's Five Forces: Threat of substitutes
The threat of substitutes in the imaging technology market is significant due to various factors affecting consumer choice and technology advancement.
Availability of alternative imaging technologies
Key alternatives to Q Technology’s products include CCD (Charge-Coupled Device) and CMOS (Complementary Metal-Oxide-Semiconductor) technologies. According to a report by Market Research Future, the global imaging sensor market is expected to reach USD 28.6 billion by 2025, growing at a CAGR of 10.4% from 2020 to 2025.
Substitutes with lower cost and similar features
Substitute products often provide similar functionality at a lower cost. For instance, the average price of CMOS sensors is approximately 30% lower than that of traditional CCD sensors. The introduction of low-cost alternatives by brands such as OmniVision and Sony has heightened the competition in this sector.
Emerging technologies in imaging sensors
Recent advancements in imaging technology, such as the development of LIDAR and hyperspectral imaging, pose a threat to existing imaging sensor products. The LIDAR market alone is projected to reach USD 4.6 billion by 2025, growing at a CAGR of 23.4%, according to Market and Markets.
Consumer preference shifts to newer technologies
There has been a noticeable shift toward newer technologies such as AI-enhanced imaging and machine learning applications in imaging. According to a 2022 survey by Deloitte, nearly 52% of consumers expressed a preference for devices incorporating AI features over traditional imaging solutions. This trend pressures Q Technology to innovate continuously.
Reduced switching costs for customers
The reduction in switching costs enables customers to easily transition to alternative products. A recent analysis indicated that 73% of imaging technology users reported minimal difficulty in switching between brands due to comparable performance and pricing, highlighting the competitive landscape.
| Technology Type | Market Share (%) | Average Price (USD) | CAGR (2020-2025) |
|---|---|---|---|
| CCD Sensors | 25% | 150 | 5.2% |
| CMOS Sensors | 55% | 105 | 10.6% |
| LIDAR | 10% | 800 | 23.4% |
| Hyperspectral Imaging | 10% | 500 | 15.0% |
In conclusion, the threat of substitutes for Q Technology (Group) Company Limited is pronounced, driven by the proliferation of lower-cost alternatives, emerging technologies, shifting consumer preferences, and reduced switching costs. These factors necessitate proactive strategies from Q Technology to maintain its market position and drive innovation.
Q Technology (Group) Company Limited - Porter's Five Forces: Threat of new entrants
The threat of new entrants in the technology and manufacturing sectors is a critical factor impacting Q Technology (Group) Company Limited. Analyzing this force involves various elements that can affect profitability and market dynamics.
High capital requirements for entry
Entering the technology sector often requires substantial initial investments. For Q Technology, capital expenditures were approximately $80 million in 2022, reflecting the high cost of advanced manufacturing equipment and research and development. The capital intensity serves as a significant barrier for potential entrants.
Strong brand and patent protection by incumbents
Q Technology holds numerous patents, with over 250 patents registered as of 2023. This strong intellectual property position not only protects their innovations but also deters new entrants who would need to navigate these patents, incurring additional costs and legal complexities. Strong brand loyalty further solidifies their market position.
Economies of scale favor existing players
With annual production exceeding 100 million units, Q Technology benefits from economies of scale that lower per-unit costs. Competitors entering the market would struggle to match these levels initially, leading to higher operational costs and diminished competitive advantage.
Regulatory hurdles in technology and manufacturing
The technology sector is characterized by stringent regulatory requirements. Compliance costs can be significant; for instance, regulatory compliance expenditures for Q Technology reached around $10 million in 2022. New entrants must navigate these complex regulations, posing an additional barrier to entry.
New entrants need significant technological expertise
The level of technological expertise required to compete in the smartphone components industry is considerable. Q Technology’s R&D expenses were about $25 million in the last fiscal year, underlining the level of investment in expertise needed to develop competitive products. This requirement filters out less capable entrants who cannot afford the necessary talent and technology development.
| Factor | Data |
|---|---|
| Capital Expenditures (2022) | $80 million |
| Patents Held | 250 patents |
| Annual Production Volume | 100 million units |
| Regulatory Compliance Costs (2022) | $10 million |
| R&D Expenses (2022) | $25 million |
Analyzing Q Technology (Group) Company Limited through Porter's Five Forces reveals a complex landscape where supplier power, customer demands, and competitive intensity shape the company's strategic decisions. With suppliers wielding significant influence and customers seeking value, Q Technology must navigate intense rivalry and the looming threat of substitutes while remaining vigilant about potential new entrants into the market. Understanding these dynamics is crucial for stakeholders aiming to position the company for sustained growth in a rapidly evolving technology sector.
[right_small]Disclaimer
All information, articles, and product details provided on this website are for general informational and educational purposes only. We do not claim any ownership over, nor do we intend to infringe upon, any trademarks, copyrights, logos, brand names, or other intellectual property mentioned or depicted on this site. Such intellectual property remains the property of its respective owners, and any references here are made solely for identification or informational purposes, without implying any affiliation, endorsement, or partnership.
We make no representations or warranties, express or implied, regarding the accuracy, completeness, or suitability of any content or products presented. Nothing on this website should be construed as legal, tax, investment, financial, medical, or other professional advice. In addition, no part of this site—including articles or product references—constitutes a solicitation, recommendation, endorsement, advertisement, or offer to buy or sell any securities, franchises, or other financial instruments, particularly in jurisdictions where such activity would be unlawful.
All content is of a general nature and may not address the specific circumstances of any individual or entity. It is not a substitute for professional advice or services. Any actions you take based on the information provided here are strictly at your own risk. You accept full responsibility for any decisions or outcomes arising from your use of this website and agree to release us from any liability in connection with your use of, or reliance upon, the content or products found herein.