
|
Q Technology Company Limited (1478.HK): SWOT Analysis |
Fully Editable: Tailor To Your Needs In Excel Or Sheets
Professional Design: Trusted, Industry-Standard Templates
Investor-Approved Valuation Models
MAC/PC Compatible, Fully Unlocked
No Expertise Is Needed; Easy To Follow
Q Technology (Group) Company Limited (1478.HK) Bundle
In the fast-paced world of technology, understanding a company's competitive position is crucial for success. Q Technology (Group) Company Limited stands at the forefront of the camera module and fingerprint recognition sensor markets, but like any enterprise, it faces a unique set of strengths and challenges. Through a comprehensive SWOT analysis, we uncover how this innovative leader leverages its advantages while navigating potential pitfalls. Dive into this analysis to discover the strategic pathways that could shape Q Technology's future and its role in the evolving tech landscape.
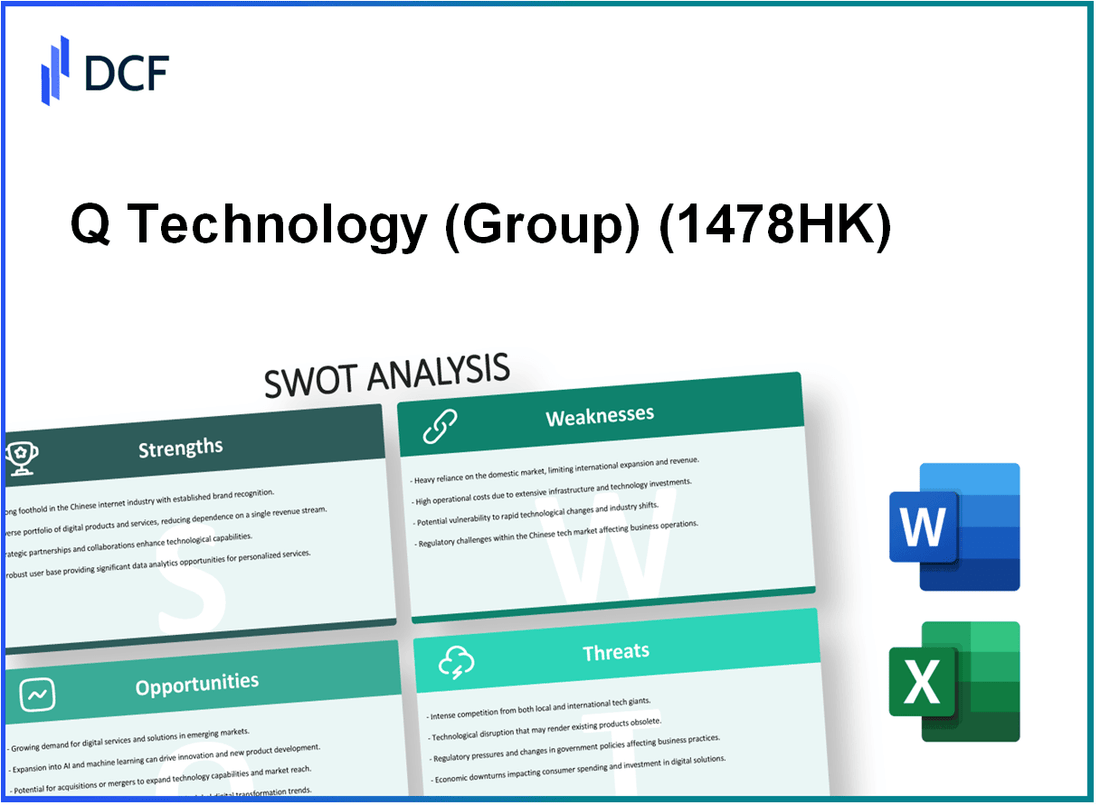
Q Technology (Group) Company Limited - SWOT Analysis: Strengths
Established leader in the camera module and fingerprint recognition sensor industries. Q Technology has positioned itself as a dominant player, particularly in the smartphone sector. As of 2023, the company holds approximately 15% market share in the global camera module industry. This strong market presence is fortified by contracts with high-profile clients, including leading smartphone manufacturers such as Apple, Samsung, and Huawei.
Strong R&D capabilities fostering innovation and product development. Q Technology allocates around 10% of its annual revenue to research and development activities. In the fiscal year 2022, their R&D expenditure amounted to approximately ¥1.2 billion (roughly $185 million). This investment has resulted in innovative products, including advanced camera modules that support up to 200 megapixels and enhanced fingerprint recognition sensors that can operate seamlessly even under various environmental conditions.
Broad customer base including major smartphone manufacturers. The company's robust distribution network extends to over 30 countries, catering to a diverse clientele. Major partnerships include agreements with top smartphone brands, contributing to about 70% of Q Technology's total revenue. In 2022, their revenue from these partnerships reached approximately ¥9 billion (around $1.38 billion).
| Year | Revenue (¥ Billion) | R&D Investment (¥ Billion) | Market Share (%) |
|---|---|---|---|
| 2020 | ¥7.2 | ¥0.6 | 13% |
| 2021 | ¥8.1 | ¥1.0 | 14% |
| 2022 | ¥9.0 | ¥1.2 | 15% |
| 2023 (Projected) | ¥10.5 | ¥1.5 | 16% |
Solid financial performance with consistent revenue growth. Q Technology has demonstrated strong financial stability, with a compound annual growth rate (CAGR) of 15% over the past three years. For the fiscal year 2022, the company's revenue reached ¥9 billion, reflecting a growth of approximately 11.1% compared to 2021. Moreover, the company's gross profit margin stands around 30%, indicating effective cost management and operational efficiency.
Q Technology (Group) Company Limited - SWOT Analysis: Weaknesses
Q Technology (Group) Company Limited exhibits several notable weaknesses that could hinder its growth and performance in the competitive tech landscape.
High dependency on the smartphone industry for revenue
As of 2022, approximately 86% of Q Technology’s revenue was derived from the smartphone sector. This heavy reliance on a single market segment makes the company vulnerable to fluctuations in consumer demand and competitive pressures within the smartphone industry.
Limited market diversification outside of consumer electronics
Q Technology has minimal exposure beyond consumer electronics, with only 14% of its revenues generated from non-smartphone products. This lack of diversification limits the company’s ability to offset risks associated with downturns in the smartphone market.
Vulnerability to rapid technological changes and product obsolescence
The consumer electronics sector is characterized by rapid innovation. Q Technology's inability to keep pace with these advancements can lead to product obsolescence. For instance, the company witnessed a depreciation in the value of its older product lines, with declines of up to 25% in market share for outdated components in 2023 as newer technologies emerged.
High operating costs impacting profit margins
In the latest fiscal year, Q Technology reported operating expenses at 30% of total revenue, significantly impacting profit margins. The company’s net profit margin stood at 4%, compared to the industry average of 8%, indicating that high operating costs are constraining its profitability.
| Weakness Factor | Statistic/Impact |
|---|---|
| Revenue Dependency on Smartphones | 86% of total revenue |
| Revenue from Non-Smartphone Products | 14% of total revenue |
| Market Share Decline for Older Products | 25% decline |
| Operating Expenses | 30% of total revenue |
| Net Profit Margin | 4% (Industry average: 8%) |
These weaknesses highlight critical vulnerabilities that Q Technology must address to sustain its competitive position and ensure long-term profitability.
Q Technology (Group) Company Limited - SWOT Analysis: Opportunities
The global demand for advanced imaging solutions continues to grow, particularly in the IoT and automotive sectors. According to a report by MarketsandMarkets, the global IoT market is projected to reach $1.1 trillion by 2026, growing at a CAGR of 25.4% from 2021. This surge is expected to increase the demand for high-performance imaging modules for smart devices and connected vehicles, presenting a significant opportunity for Q Technology.
Additionally, the automotive industry is undergoing a transformation with the introduction of advanced driver-assistance systems (ADAS) and autonomous vehicles. The global market for automotive cameras is anticipated to reach $8.6 billion by 2025, expanding at a CAGR of 17.6% from 2020. Q Technology can capitalize on these trends by providing cutting-edge imaging solutions tailored for these applications.
Emerging markets present another avenue for growth, particularly driven by the rising smartphone adoption. Research from Statista indicates that global smartphone users are expected to surpass 6.8 billion by 2023. In regions such as Southeast Asia and Africa, smartphone penetration is rapidly increasing, which translates to a growing demand for enhanced camera technologies. For instance, in Southeast Asia, smartphone adoption has grown by 13% year-over-year in 2022.
Moreover, strategic partnerships and collaborations are vital for innovative tech development in imaging solutions. Q Technology has an opportunity to forge alliances with tech giants and startups to co-develop new imaging applications. Notably, partnerships can also enhance R&D capabilities, allowing for faster product launches and greater market reach.
The increasing integration of AI in imaging technologies further opens up new opportunities. AI-driven enhancements in imaging can provide functionalities such as better low-light performance, advanced object recognition, and real-time analytics. The AI in the image recognition market is projected to grow from $27.3 billion in 2023 to $60.2 billion by 2027, at a CAGR of 21.7%, indicating a growing trend that Q Technology can leverage for its products.
| Opportunity | Market Size/Projection | Growth Rate (CAGR) |
|---|---|---|
| IoT Market | $1.1 trillion by 2026 | 25.4% |
| Automotive Camera Market | $8.6 billion by 2025 | 17.6% |
| Global Smartphone Users | 6.8 billion by 2023 | 13% YoY Growth (Southeast Asia) |
| AI in Image Recognition Market | $60.2 billion by 2027 | 21.7% |
Q Technology (Group) Company Limited - SWOT Analysis: Threats
Q Technology (Group) Company Limited faces several significant threats that could impact its business operations and market position.
Intense competition from other global technology providers
The technology sector is characterized by rapid innovation and fierce competition. Q Technology competes with major players like Apple, Samsung, and Huawei. In 2022, Apple held approximately 23% of the global smartphone market share, while Samsung followed closely with around 19%. This competition pressures pricing strategies and market share for Q Technology.
Fluctuations in supply chain and material costs
Recent global events have led to volatility in supply chains and raw material prices. For instance, as of Q3 2023, the cost of semiconductor chips has surged by over 25% due to shortages, impacting production costs for tech companies. Furthermore, Q Technology has reported that its material costs have increased by over 15% in the past year, squeezing profit margins.
Regulatory challenges in key markets affecting operations
Regulatory scrutiny is increasing in critical markets like the European Union and the United States. In 2023, the EU proposed stricter regulations on data privacy and cybersecurity, which could lead to increased operational costs for compliance. Additionally, Q Technology faces potential tariffs on its products; the U.S. tariffs on certain electronics from China were around 25%, affecting cost structures and pricing decisions.
Potential economic downturns impacting consumer spending on electronics
The global economy is facing uncertainties that could dampen consumer spending. In 2023, analysts predicted a potential recession, with consumer spending expected to decline by 2% in the electronics sector. This downturn could directly affect Q Technology's sales, as consumers may prioritize essential goods over luxury electronics.
| Threat | Description | Impact on Q Technology |
|---|---|---|
| Intense Competition | Fierce rivalry from global players like Apple and Samsung | Possible market share erosion |
| Supply Chain Fluctuations | Increased costs in semiconductor chips and raw materials | Margin compression; increased production costs |
| Regulatory Challenges | Stricter EU data privacy and potential U.S. tariffs | Increased compliance costs and pricing pressures |
| Economic Downturns | Predicted 2% decline in consumer electronics spending | Reduction in sales and revenue |
These threats necessitate strategic foresight and agile responses from Q Technology to navigate the competitive landscape and maintain its market presence.
Q Technology (Group) Company Limited stands at a pivotal crossroads, leveraging its strengths while navigating its weaknesses. As opportunities in emerging markets and advanced imaging technologies unfold, the company must remain vigilant against the threats of competition and economic volatility. With a strategic approach, Q Technology can capitalize on its innovative spirit and robust market position to continue thriving in the dynamic tech landscape.
Disclaimer
All information, articles, and product details provided on this website are for general informational and educational purposes only. We do not claim any ownership over, nor do we intend to infringe upon, any trademarks, copyrights, logos, brand names, or other intellectual property mentioned or depicted on this site. Such intellectual property remains the property of its respective owners, and any references here are made solely for identification or informational purposes, without implying any affiliation, endorsement, or partnership.
We make no representations or warranties, express or implied, regarding the accuracy, completeness, or suitability of any content or products presented. Nothing on this website should be construed as legal, tax, investment, financial, medical, or other professional advice. In addition, no part of this site—including articles or product references—constitutes a solicitation, recommendation, endorsement, advertisement, or offer to buy or sell any securities, franchises, or other financial instruments, particularly in jurisdictions where such activity would be unlawful.
All content is of a general nature and may not address the specific circumstances of any individual or entity. It is not a substitute for professional advice or services. Any actions you take based on the information provided here are strictly at your own risk. You accept full responsibility for any decisions or outcomes arising from your use of this website and agree to release us from any liability in connection with your use of, or reliance upon, the content or products found herein.