
|
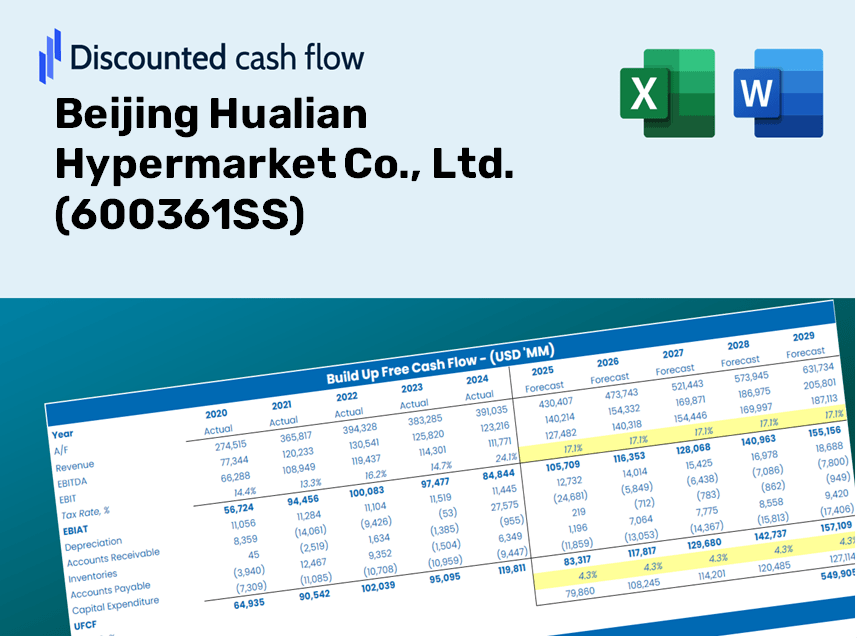
Beijing Hualian Hypermarket Co., Ltd. (600361.SS) DCF Valuation |
Fully Editable: Tailor To Your Needs In Excel Or Sheets
Professional Design: Trusted, Industry-Standard Templates
Investor-Approved Valuation Models
MAC/PC Compatible, Fully Unlocked
No Expertise Is Needed; Easy To Follow
Beijing Hualian Hypermarket Co., Ltd. (600361.SS) Bundle
Designed for accuracy, our (600361SS) DCF Calculator enables you to assess Beijing Hualian Hypermarket Co., Ltd. valuation using up-to-date financial data and offers complete versatility to modify all essential parameters for improved projections.
Discounted Cash Flow (DCF) - (USD MM)
| Year | AY1 2020 |
AY2 2021 |
AY3 2022 |
AY4 2023 |
AY5 2024 |
FY1 2025 |
FY2 2026 |
FY3 2027 |
FY4 2028 |
FY5 2029 |
|---|---|---|---|---|---|---|---|---|---|---|
| Revenue | 9,548.7 | 59,429.3 | 69,319.3 | 72,843.6 | 80,941.5 | 79,446.6 | 77,979.3 | 76,539.1 | 75,125.5 | 73,738.0 |
| Revenue Growth, % | 0 | 522.38 | 16.64 | 5.08 | 11.12 | -1.85 | -1.85 | -1.85 | -1.85 | -1.85 |
| EBITDA | 388.8 | 1,622.3 | 1,984.1 | 1,918.6 | 2,299.4 | 2,405.5 | 2,361.0 | 2,317.4 | 2,274.6 | 2,232.6 |
| EBITDA, % | 4.07 | 2.73 | 2.86 | 2.63 | 2.84 | 3.03 | 3.03 | 3.03 | 3.03 | 3.03 |
| Depreciation | 129.3 | 345.2 | 423.3 | 449.4 | 620.9 | 624.3 | 612.8 | 601.5 | 590.4 | 579.5 |
| Depreciation, % | 1.35 | 0.58092 | 0.61059 | 0.61699 | 0.76706 | 0.78584 | 0.78584 | 0.78584 | 0.78584 | 0.78584 |
| EBIT | 259.6 | 1,277.0 | 1,560.9 | 1,469.2 | 1,678.5 | 1,781.1 | 1,748.3 | 1,716.0 | 1,684.3 | 1,653.2 |
| EBIT, % | 2.72 | 2.15 | 2.25 | 2.02 | 2.07 | 2.24 | 2.24 | 2.24 | 2.24 | 2.24 |
| Total Cash | 3,035.0 | 6,000.0 | 3,832.4 | 4,500.6 | 7,882.7 | 10,062.1 | 9,876.3 | 9,693.9 | 9,514.8 | 9,339.1 |
| Total Cash, percent | .0 | .0 | .0 | .0 | .0 | .0 | .0 | .0 | .0 | .0 |
| Account Receivables | 484.2 | 2,565.9 | 3,641.9 | 2,783.8 | 4,018.9 | 3,722.7 | 3,653.9 | 3,586.4 | 3,520.2 | 3,455.2 |
| Account Receivables, % | 5.07 | 4.32 | 5.25 | 3.82 | 4.97 | 4.69 | 4.69 | 4.69 | 4.69 | 4.69 |
| Inventories | 1,095.4 | 2,701.7 | 3,111.2 | 3,631.8 | 3,593.0 | 4,755.9 | 4,668.0 | 4,581.8 | 4,497.2 | 4,414.2 |
| Inventories, % | 11.47 | 4.55 | 4.49 | 4.99 | 4.44 | 5.99 | 5.99 | 5.99 | 5.99 | 5.99 |
| Accounts Payable | 2,561.4 | 5,287.9 | 992.6 | 965.8 | 2,538.3 | 6,612.6 | 6,490.4 | 6,370.6 | 6,252.9 | 6,137.4 |
| Accounts Payable, % | 26.82 | 8.9 | 1.43 | 1.33 | 3.14 | 8.32 | 8.32 | 8.32 | 8.32 | 8.32 |
| Capital Expenditure | -183.0 | -171.8 | -564.5 | -2,312.1 | -1,634.9 | -1,305.2 | -1,281.1 | -1,257.4 | -1,234.2 | -1,211.4 |
| Capital Expenditure, % | -1.92 | -0.28914 | -0.8143 | -3.17 | -2.02 | -1.64 | -1.64 | -1.64 | -1.64 | -1.64 |
| Tax Rate, % | 24.07 | 24.07 | 24.07 | 24.07 | 24.07 | 24.07 | 24.07 | 24.07 | 24.07 | 24.07 |
| EBITAT | 128.3 | 1,040.2 | 1,267.5 | 1,133.2 | 1,274.6 | 1,300.8 | 1,276.8 | 1,253.2 | 1,230.1 | 1,207.3 |
| Depreciation | ||||||||||
| Changes in Account Receivables | ||||||||||
| Changes in Inventories | ||||||||||
| Changes in Accounts Payable | ||||||||||
| Capital Expenditure | ||||||||||
| UFCF | 1,056.3 | 252.0 | -4,654.5 | -418.7 | 636.6 | 3,827.5 | 642.9 | 631.1 | 619.4 | 608.0 |
| WACC, % | 6.07 | 6.53 | 6.53 | 6.47 | 6.45 | 6.41 | 6.41 | 6.41 | 6.41 | 6.41 |
| PV UFCF | ||||||||||
| SUM PV UFCF | 5,617.2 | |||||||||
| Long Term Growth Rate, % | 3.00 | |||||||||
| Free cash flow (T + 1) | 626 | |||||||||
| Terminal Value | 18,361 | |||||||||
| Present Terminal Value | 13,458 | |||||||||
| Enterprise Value | 19,075 | |||||||||
| Net Debt | 932 | |||||||||
| Equity Value | 18,143 | |||||||||
| Diluted Shares Outstanding, MM | 4,260 | |||||||||
| Equity Value Per Share | 4.26 |
What You Can Expect
- Authentic BHHM Financial Data: Comes pre-loaded with Beijing Hualian Hypermarket's historical and forecasted figures for accurate analysis.
- Easily Customizable Template: Adjust essential inputs such as revenue growth, WACC, and EBITDA % effortlessly.
- Real-Time Calculations: Watch the intrinsic value of BHHM update immediately as you make adjustments.
- Professional Valuation Tool: Tailored for investors, analysts, and consultants aiming for reliable DCF outcomes.
- Intuitive Design: User-friendly format and straightforward instructions suitable for all skill levels.
Key Features
- Comprehensive Financial Data: Access precise historical and projected financial information for Beijing Hualian Hypermarket Co., Ltd. (600361SS).
- Adjustable Forecast Parameters: Modify the highlighted cells for key factors such as WACC, growth rates, and profit margins.
- Real-Time Calculations: Instant updates for DCF, Net Present Value (NPV), and cash flow assessments.
- User-Friendly Visual Dashboard: Intuitive charts and summaries that clearly present your valuation findings.
- Designed for All Levels: A straightforward layout tailored for investors, CFOs, and consultants alike.
How It Functions
- Step 1: Download the Excel file.
- Step 2: Review the pre-filled financial data and forecasts for Beijing Hualian Hypermarket Co., Ltd. (600361SS).
- Step 3: Adjust key inputs such as revenue growth, WACC, and tax rates (highlighted cells).
- Step 4: Observe the DCF model refresh in real-time as you modify your assumptions.
- Step 5: Evaluate the outputs and leverage the findings for your investment strategies.
Why Choose This Calculator for Beijing Hualian Hypermarket Co., Ltd. (600361SS)?
- User-Friendly Interface: Crafted to be accessible for both novices and seasoned professionals.
- Customizable Inputs: Effortlessly adjust parameters to suit your analytical needs.
- Real-Time Valuation: Monitor immediate updates to Beijing Hualian's valuation as you tweak inputs.
- Preloaded Financial Data: Comes equipped with Beijing Hualian’s actual financial figures for swift analysis.
- Professionally Endorsed: Favored by investors and analysts for making well-informed choices.
Who Can Benefit from This Product?
- Investors: Evaluate the valuation of Beijing Hualian Hypermarket Co., Ltd. (600361SS) before making investment decisions.
- CFOs and Financial Analysts: Optimize valuation workflows and validate financial projections.
- Startup Founders: Discover the valuation practices of established companies like Beijing Hualian Hypermarket Co., Ltd. (600361SS).
- Consultants: Create comprehensive valuation reports for your clients.
- Students and Educators: Utilize real market data to practice and teach valuation methodologies.
Contents of the Template
- Operating and Balance Sheet Data: Pre-filled historical data and forecasts for Beijing Hualian Hypermarket Co., Ltd. (600361SS), including revenue, EBITDA, EBIT, and capital expenditures.
- WACC Calculation: A dedicated sheet for Weighted Average Cost of Capital (WACC), featuring parameters such as Beta, risk-free rate, and share price.
- DCF Valuation (Unlevered and Levered): Customizable Discounted Cash Flow models that display intrinsic value along with detailed calculations.
- Financial Statements: Pre-loaded financial statements (annual and quarterly) to aid in analysis.
- Key Ratios: Incorporates profitability, leverage, and efficiency ratios for Beijing Hualian Hypermarket Co., Ltd. (600361SS).
- Dashboard and Charts: Visual summaries of valuation outputs and assumptions for easy result analysis.
Disclaimer
All information, articles, and product details provided on this website are for general informational and educational purposes only. We do not claim any ownership over, nor do we intend to infringe upon, any trademarks, copyrights, logos, brand names, or other intellectual property mentioned or depicted on this site. Such intellectual property remains the property of its respective owners, and any references here are made solely for identification or informational purposes, without implying any affiliation, endorsement, or partnership.
We make no representations or warranties, express or implied, regarding the accuracy, completeness, or suitability of any content or products presented. Nothing on this website should be construed as legal, tax, investment, financial, medical, or other professional advice. In addition, no part of this site—including articles or product references—constitutes a solicitation, recommendation, endorsement, advertisement, or offer to buy or sell any securities, franchises, or other financial instruments, particularly in jurisdictions where such activity would be unlawful.
All content is of a general nature and may not address the specific circumstances of any individual or entity. It is not a substitute for professional advice or services. Any actions you take based on the information provided here are strictly at your own risk. You accept full responsibility for any decisions or outcomes arising from your use of this website and agree to release us from any liability in connection with your use of, or reliance upon, the content or products found herein.