
|
Beijing Hualian Hypermarket Co., Ltd. (600361.SS): SWOT Analysis [Dec-2025 Updated] |
Fully Editable: Tailor To Your Needs In Excel Or Sheets
Professional Design: Trusted, Industry-Standard Templates
Investor-Approved Valuation Models
MAC/PC Compatible, Fully Unlocked
No Expertise Is Needed; Easy To Follow
Beijing Hualian Hypermarket Co., Ltd. (600361.SS) Bundle
Beijing Hualian sits on a powerful local moat-prime Beijing malls, a 5.8M-strong loyalty base and a successful pivot to higher-margin rental income-but that strength is tempered by heavy debt, risky concentration in one market and rising competition from warehouse clubs and e‑commerce; the coming winners will be those who convert data-driven membership insights into community-focused O2O formats, senior-oriented services and greener assets to stabilize cash flow and fend off margin pressure-read on to see how Hualian can turn these tensions into a durable advantage.
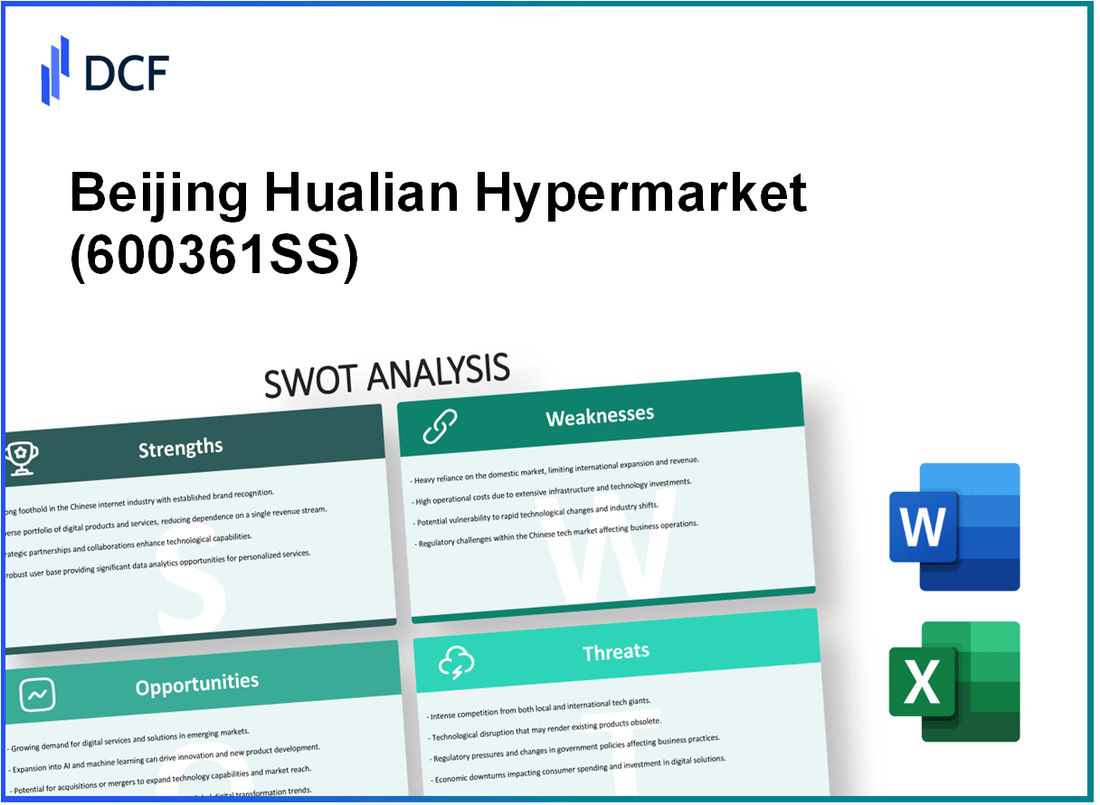
Beijing Hualian Hypermarket Co., Ltd. (600361.SS) - SWOT Analysis: Strengths
Dominant market position in Beijing retail: as of Q3 2025 the company operates 25 large-scale shopping centers within the Beijing metropolitan area, enabling direct exposure to the city's estimated 1.2 trillion RMB annual retail sales volume. Rental income from these prime locations contributed approximately 65% of total gross profit in the 2024 fiscal year. The portfolio maintains an average occupancy rate of 94.5% across core Beijing properties, supporting stable rental cash flows despite broader market volatility.
The following table summarizes the core portfolio metrics:
| Metric | Value |
|---|---|
| Number of Beijing shopping centers (Q3 2025) | 25 |
| Beijing retail market size (annual) | 1.2 trillion RMB |
| Share of gross profit from rental income (2024) | 65% |
| Average occupancy rate (core Beijing properties) | 94.5% |
| Property leasing revenue (2024 audited) | 4.2 billion RMB |
Robust membership ecosystem and loyalty data: the BHG loyalty program reported over 5.8 million active members as of December 2025. Member-driven sales account for 42% of total retail revenue, up 5 percentage points year-over-year. The average transaction value (ATV) for loyalty members is 215 RMB versus 145 RMB for non-members, indicating materially higher spend per visit among members.
Key loyalty program statistics:
| Metric | Members / Value |
|---|---|
| Active loyalty members (Dec 2025) | 5.8 million |
| Member-driven share of retail revenue | 42% |
| YoY increase in member share | +5 percentage points |
| Average transaction value - members | 215 RMB |
| Average transaction value - non-members | 145 RMB |
| Estimated marketing waste reduction via analytics | 15% |
Benefits from the loyalty database include:
- Precision-targeted digital promotions reducing marketing spend wastage by c.15%
- Higher ATV and frequency from members driving retail tenants' sales
- Enhanced negotiating leverage with tenants based on verified footfall and spend data
Strategic shift to high-margin rental income: the company's pivot from direct hypermarket operations to a shopping center management model increased gross margins to 28.6% in 2025. Rental and management fee income grew by 7.2% year-over-year, delivering more predictable cash flow than grocery sales. The rental segment recorded effectively zero inventory turnover days, and now accounts for approximately 70% of operating profit.
Financial breakdown illustrating the structural pivot:
| Metric | 2024 / 2025 |
|---|---|
| Gross margin (2025) | 28.6% |
| YoY growth in rental & management income | +7.2% |
| Rental segment share of operating profit | 70% |
| Inventory turnover days - rental segment | 0 days |
| Property leasing revenue (2024 audited) | 4.2 billion RMB |
Strong synergy with the Hualian Group: Beijing Hualian Hypermarket benefits from the Beijing Hualian Group's national network of over 150 outlets, shared logistics and procurement, and premium brand partnerships (including SKP). These synergies reduced administrative expenses by 4% as a percentage of revenue and increased foot traffic and center prestige. In early 2025 the parent provided credit guarantees totaling 1.5 billion RMB for low-interest corporate bonds, lowering the company's effective cost of capital relative to independent peers.
Synergy and financing metrics:
| Metric | Value / Impact |
|---|---|
| Parent group outlets (national) | Over 150 |
| Reduction in admin expenses (% of revenue) | 4% |
| Parent credit guarantees (early 2025) | 1.5 billion RMB |
| Impact on cost of capital | Lowered vs independent operators |
| Enhanced tenant draw via premium partnerships | Positive uplift to foot traffic and rental pricing |
Beijing Hualian Hypermarket Co., Ltd. (600361.SS) - SWOT Analysis: Weaknesses
High financial leverage and debt obligations constrain strategic flexibility. As of the Q3 2025 financial report the company reports a total debt-to-asset ratio of 68.2 percent, with total liabilities of 42.6 billion RMB against total assets of 62.5 billion RMB. Interest expenses for the first nine months of 2025 reached 410 million RMB, reducing net profit margin to 2.4 percent (net profit of 240 million RMB on trailing 12-month revenue of 10.0 billion RMB). The current ratio stands at 0.85 (current assets 7.65 billion RMB, current liabilities 9.0 billion RMB), indicating potential liquidity pressures for short-term obligations maturing in the 2026 fiscal year. Capital expenditures for mall renovations have been capped at 500 million RMB annually to preserve cash flow, limiting reinvestment capacity and the ability to service rising debt without asset sales or external financing. This financial structure restricts the ability to compete with well-funded international private equity retail groups that typically operate with lower leverage and larger cash war chests.
| Metric | Value |
| Total assets (Q3 2025) | 62.5 billion RMB |
| Total liabilities (Q3 2025) | 42.6 billion RMB |
| Debt-to-asset ratio | 68.2% |
| Interest expense (Jan-Sep 2025) | 410 million RMB |
| Net profit margin (trailing 12 months) | 2.4% |
| Current ratio | 0.85 |
| Annual capex for renovations | 500 million RMB |
Geographic concentration risk in Beijing reduces portfolio resilience. Over 80 percent of the company's total asset value is concentrated within the Beijing-Tianjin-Hebei region as of late 2025 (regional assets: ~50.0 billion RMB of 62.5 billion RMB total). Leasing and rental income from Beijing properties account for approximately 78 percent of rental revenue (3.12 billion RMB of 4.0 billion RMB annual rental revenue). This lack of diversification makes the company highly vulnerable to local economic downturns, policy shifts, or zoning and licensing changes in the capital. Beijing's GDP grew by 4.8 percent in 2024, but any stagnation or policy tightening in this single market would directly impact occupancy, rental reversion, and footfall across the portfolio. Attempts to penetrate Tier-2 cities have been limited: market share in Tier-2 cities remains below 1.5 percent, with new-store openings constrained by capital allocation and site-selection experience outside the home region.
- Regional asset concentration: 80% of assets in Beijing-Tianjin-Hebei (~50.0 billion RMB).
- Rental dependency: 78% of rental revenue sourced from Beijing (~3.12 billion RMB of 4.0 billion RMB).
- Limited Tier-2 presence: market share <1.5% and fewer than 10 active properties outside Tier-1 as of 12/2025.
Declining foot traffic in traditional formats is eroding revenue productivity. Foot traffic in older department store and legacy hypermarket formats has declined 6 percent year-over-year as of the 2025 mid-year review, reducing average transaction volumes and conversion rates. Approximately 15 percent of the company's gross leasable area (GLA) is underutilized or vacant (GLA underutilized: 210,000 sqm of total GLA 1.4 million sqm). The estimated cost to repurpose these aging assets to experiential or mixed-use formats is approximately 12,000 RMB per square meter, which exceeds current renovation budgets and the annual capex allocation. As a result, average revenue per square meter has stagnated at 3,200 RMB over the last three fiscal quarters (~3,200 RMB/sqm/quarter or annualized 12,800 RMB/sqm), compressing asset yields and widening the gap versus newer lifestyle malls that report 15-25 percent higher revenue density.
| Foot traffic change (YoY, mid‑2025) | -6% |
| Underutilized GLA | 210,000 sqm (15% of 1.4 million sqm) |
| Repurposing cost estimate | 12,000 RMB/sqm |
| Average revenue per sqm (last 3 quarters) | 3,200 RMB per quarter (annualized 12,800 RMB/sqm) |
High operating costs in Tier-1 cities are compressing margins and limiting competitiveness. Labor costs in Beijing rose by 5.5 percent and utility costs by 8 percent during the 2025 calendar year. Selling and distribution expenses now consume 18.4 percent of total revenue (up from 16.2 percent two years prior), reflecting higher logistics, payroll, and marketing spends. Minimum wage adjustments in the capital resulted in an estimated 300 million RMB increase in annual personnel spending. Maintaining premium mall standards requires elevated headcount and service levels; current automation and digital labor-replacement initiatives cover less than 12 percent of routine staffing needs, insufficient to offset wage inflation. As a result, operating margin has been progressively compressed despite successful rental-rate increases and selective tenant mix optimization.
- Labor cost increase (2025): +5.5% in Beijing.
- Utility cost increase (2025): +8% in Beijing.
- Selling & distribution expense: 18.4% of revenue (current) vs 16.2% (2023).
- Incremental personnel cost due to wage policy: +300 million RMB annually.
- Automation coverage of routine staffing: ~12% of roles.
Beijing Hualian Hypermarket Co., Ltd. (600361.SS) - SWOT Analysis: Opportunities
Expansion into community-based retail centers aligns with the national 15-minute community life circle initiative (2025 target). BHG plans to open 5 community-centric mini-malls by end-2026 focused on grocery, pharmacy, dining, and basic services. These mini-malls require ~40% less initial capital than flagship regional centers; average capex per mini-mall is estimated at RMB 28 million versus RMB 46.7 million for a regional center. Projected internal rate of return (IRR) for community projects is 12% across a seven-year horizon. Urban planning trends indicate reduced consumer travel-to-shop distances and higher frequency of small basket purchases, supporting faster payback and stable cash flows.
| Metric | Mini-mall (Community) | Flagship Regional Center |
|---|---|---|
| Average Initial Capex (RMB) | 28,000,000 | 46,700,000 |
| Capex Reduction vs Regional | 40% | - |
| Projected IRR (7 years) | 12% | 10.5% |
| Target Openings by 2026 | 5 | 1 (expansion/upgrade) |
| Primary Offerings | Essential retail, pharmacy, F&B, services | Anchor retail, entertainment, large F&B |
Integration of O2O and digital commerce: the company targets digital sales contribution rising from 12% in 2024 to 20% by end-2025. The BHG Cloud 3.0 system currently integrates 5.5 million active loyalty members into a unified CRM and personalization engine. Partnerships with Meituan and Ele.me extend delivery coverage to a 5 km radius, reaching ~85% of Beijing urban residents (population coverage estimated at 14.2 million of 16.7 million municipal residents in urban districts). A dedicated RMB 200 million technology upgrade fund (2025 budget) supports smart parking, AI-driven foot traffic analytics, and last-mile logistics improvements. Expected outcomes include a 15% annual improvement in tenant turnover rates and increased average basket size for omnichannel customers by 18%.
- Digital sales: 12% (2024) → target 20% (2025)
- BHG Cloud 3.0 members integrated: 5.5 million
- Delivery radius: 5 km; population coverage: 85% of Beijing urban residents (~14.2M)
- Tech fund: RMB 200 million (2025)
- Expected tenant turnover improvement: +15% annually
- Expected omnichannel basket size increase: +18%
| Digital KPI | Baseline (2024) | Target (End-2025) |
|---|---|---|
| Digital sales as % of total | 12% | 20% |
| Active loyalty members (integrated) | 5,500,000 | 6,200,000 (projected) |
| Technology investment | - | RMB 200,000,000 |
| Delivery coverage (Beijing urban) | 60% (pre-partnership) | 85% (post-partnership) |
Growth in the silver economy segment: Beijing's aging population (aging 60+ share increasing) controls ~30% of household disposable income in 2025. BHG is reconfiguring 10% of total leasable floor area across pilot properties to senior-friendly healthcare, wellness, and leisure services. Pilot zones report 20% higher dwell time versus traditional retail sections and improved cross-purchase rates. Revenue from senior-focused tenants is forecasted to compound at 9% CAGR through 2028. These investments target resilient spending patterns less impacted by youth-oriented e-commerce and provide higher rent stability with lower vacancy risk.
- Floor space reconfiguration: 10% of portfolio leasable area (pilot phase)
- Observed dwell time increase in pilots: +20%
- Projected revenue CAGR for senior tenants (2025-2028): 9%
- Household disposable income controlled by seniors (Beijing, 2025): ~30%
| Silver Economy KPI | Value / Projection |
|---|---|
| Portfolio area reconfigured | 10% |
| Dwell time vs traditional | +20% |
| Revenue CAGR (senior tenants, 2025-2028) | 9% |
| Targeted senior demographic income share (Beijing) | ~30% of household disposable income |
Green financing and ESG initiatives: the company issued its first green bond of RMB 800 million in mid-2025 with a coupon 50 basis points below comparable standard debt, reducing annual interest expense. Energy retrofit programs-LED lighting and smart HVAC systems-are projected to cut energy costs by 18% by 2027. Eligible government subsidies and tax credits for energy-efficient commercial buildings could provide up to RMB 50 million per year. Institutional investor interest increased with international holdings now representing 6% of the free float, improving access to lower-cost capital and enhancing valuation multiples for sustainability-aligned assets.
- Green bond issued: RMB 800,000,000 (mid-2025)
- Coupon reduction vs standard debt: 50 bps
- Projected energy cost reduction by 2027: 18%
- Potential annual government tax credits/subsidies: up to RMB 50,000,000
- International institutional ownership of float: 6%
| ESG Metric | Current / Committed |
|---|---|
| Green bond size (RMB) | 800,000,000 |
| Coupon advantage vs standard | 50 basis points lower |
| Energy cost savings target by 2027 | 18% |
| Annual government subsidy potential (RMB) | 50,000,000 |
| International institutional ownership (float) | 6% |
Beijing Hualian Hypermarket Co., Ltd. (600361.SS) - SWOT Analysis: Threats
Intense competition from warehouse clubs has materially eroded Hualian's market position in the Beijing-Tianjin-Hebei (Jing-Jin-Ji) region. Rapid expansion by Sam's Club and Costco diverted ~8% of high-spending household traffic away from Hualian. Competitors have announced four new locations in Beijing by end-2026 that overlap Hualian's core catchment areas, increasing local store-level competitive intensity and cannibalization risk.
Pricing pressure from bulk retailers has reduced gross merchandise margins in Hualian's grocery segment by ~120 basis points (1.20 percentage points) year-over-year. Membership model competitors report renewal rates >80%, locking in high-LTV customers and increasing switching costs for Hualian.
| Metric | Hualian Impact | Competitor Benchmark |
|---|---|---|
| High-spending household traffic diverted | ~8% | - |
| New warehouse club openings (Beijing, by 2026) | 4 overlapping sites | Sam's/Costco expansion plans |
| Grocery gross margin change | -120 bps | Industry bulk-retailer margins lower by ~150-200 bps |
| Membership renewal rate (competitors) | - | >80% |
E-commerce dominance and livestreaming have shifted purchase funnels and tenant economics. Online retail penetration in China reached 32% of total social consumer goods sales by late 2025. Livestreaming platforms (Douyin, Kuaishou) captured a disproportionate share of apparel and cosmetics demand-categories critical to Hualian's mall tenants-resulting in a 10% reduction in base rent outcomes for fashion retailers during the 2025 lease renewal cycle.
Physical stores increasingly risk becoming showrooms for online conversions: attribution leakage and "click-and-collect" cannibalization lower in-store average ticket capture. Digital advertising costs to drive physical foot traffic rose by ~25% YoY, raising customer acquisition costs (CAC) for omnichannel promotions and reducing ROI on O2O campaigns.
- Online retail penetration: 32% of social consumer goods sales (late 2025).
- Base rent negotiation impact for fashion tenants: -10% (2025 renewal cycle).
- Digital ad CPI/CPC increases driving physical visits: +25% YoY.
- Risk: stores become order-fulfillment/showroom channels with low transaction capture.
Macroeconomic volatility and weak consumer sentiment present continued downside risk to discretionary spend within Hualian malls. China's retail sales growth slowed to 3.5% in H2 2025, correlating with a 7% decline in luxury and high-end electronics sales across Hualian locations. The consumer confidence index remains below pre-2020 levels, reducing frequency and ticket size among Hualian's core Beijing homeowner customer base.
Property market fluctuations have diminished the wealth effect for primary customers, further reducing consumption of higher-margin discretionary categories. Forecast stress scenarios indicate that a continued slowdown could reduce same-store sales growth by 3-6% annually across non-food categories.
| Macro Variable | 2025 Outcome | Potential 2026 Impact on Hualian |
|---|---|---|
| Retail sales growth (China) | 3.5% (H2 2025) | Lower foot traffic, weaker discretionary spend |
| Luxury & high-end electronics sales (Hualian malls) | -7% (2025) | Margin compression; tenant churn risk |
| Consumer confidence vs. pre-2020 | Below pre-2020 | Frequency/ticket declines |
| Potential VAT increase | +1.5% on commercial services (scenario) | Net margin squeeze in 2026 |
Regulatory changes in commercial real estate and data/privacy compliance increase operating complexity and capex. Beijing zoning laws implemented in 2025 restrict new commercial development within the 5th Ring Road, which both limits future competition and raises renovation compliance costs by ~15% for existing structures. These higher capitalized renovation costs increase required returns on redevelopment projects and reduce net present value of asset-level investments.
Stricter data privacy regulations governing facial recognition and consumer tracking necessitate a major overhaul of Hualian's smart mall analytics and customer traffic measurement systems. The company faces one-off implementation costs and recurring higher legal/compliance spend, and risks reduced targeting precision that can impair personalization-driven sales uplift.
- Renovation/regulatory compliance cost increase: +15% (post-2025 Beijing zoning changes).
- Data/privacy overhaul: significant one-time IT and legal costs; potential loss of analytics granularity.
- Land-use/lease-term uncertainty: potential negative impacts on long-term asset valuations and leasing economics.
Aggregate threat metrics and potential P&L sensitivity: a combined scenario of intensified warehouse club competition, accelerating e-commerce conversion, a 1.5% VAT increase, and increased renovation/compliance costs could reduce gross margins by 150-250 bps and compress EBITDA margin by an estimated 200-350 bps in a downside 12-18 month stress case. Market-share decline in Tier-1 department store channels (reported at -4.5% YoY in 2025) further underscores structural demand shifts that could persist absent strategic countermeasures.
Disclaimer
All information, articles, and product details provided on this website are for general informational and educational purposes only. We do not claim any ownership over, nor do we intend to infringe upon, any trademarks, copyrights, logos, brand names, or other intellectual property mentioned or depicted on this site. Such intellectual property remains the property of its respective owners, and any references here are made solely for identification or informational purposes, without implying any affiliation, endorsement, or partnership.
We make no representations or warranties, express or implied, regarding the accuracy, completeness, or suitability of any content or products presented. Nothing on this website should be construed as legal, tax, investment, financial, medical, or other professional advice. In addition, no part of this site—including articles or product references—constitutes a solicitation, recommendation, endorsement, advertisement, or offer to buy or sell any securities, franchises, or other financial instruments, particularly in jurisdictions where such activity would be unlawful.
All content is of a general nature and may not address the specific circumstances of any individual or entity. It is not a substitute for professional advice or services. Any actions you take based on the information provided here are strictly at your own risk. You accept full responsibility for any decisions or outcomes arising from your use of this website and agree to release us from any liability in connection with your use of, or reliance upon, the content or products found herein.